The Digital Divide Between Canadian Cities
Labour market dynamics and regional inequality
Beata Caranci, Chief Economist | 416-982-8067
Shernette McLeod, Economist | 416-415-0413
Andrew Hencic, Economist | 416-308-0309
Date Published: August 2, 2019
Highlights
- The shift to a highly digitalized world risks exacerbating the divergence in income and job opportunities between regions. This has been most pronounced in the U.S., where superstar cities that attract highly paid tech workers leave their smaller counterparts further and further behind.
- There is less evidence that Canada reflects the regional inequality that has come to mark the U.S. experience, but Canada is developing fertile ground.
- First, regional wage inequality in Canada has been kept at bay in part due to high wage and employment opportunities within the goods-producing sector. However, the strength of this relationship has significantly diminished since 2010.
- Second, the winner-take-all tendency of tech industries has become increasingly concentrated within just five Canadian cities. A deepening of these technology hubs presents the next test for Canadian cities.
- Policymakers have taken a number of steps to address regional divergence, however greater focus is required. Technology dynamics tend to form quickly and are hard to unwind once established. Strategies should seek to extend, and not stifle, the dynamism and efficiency of clustering to more regions and encourage convergence with the rising superstar cities.
Welcome to our third report exploring the influence of technology on economic outcomes. In this report, we look at whether Canadian cities are succumbing to the forces that led to regional disparity between American cities. This is the phenomenon where ‘rich’ cities get ‘richer’ by creating a virtuous cycle that captures a disproportionate share of skilled jobs and high incomes. Cities that are not part of this inner circle face difficulties in attracting corporations that employ high-skilled talent. In the U.S., the phenomenon first took hold in the 1980s under a confluence of factors as diverse as one can imagine, including the deregulation of regional airfare, poorly managed trade policies and land use regulations.1 More recently, the lens has focused on the influence of the digital economy in accelerating inequality between cities. The heavy tilt on information technology and automation has boosted the returns to those cities that can form clusters of tech-skills, while simultaneously diminishing the returns to those that attract manual labour and non-tech heavy skills. The poster children of this impact include the likes of New York, Washington, San Francisco and San Jose, which have captured the spoils of employers at the expense of cities like Detroit, Cleveland and Kansas City.2
In Canada, the gains in employment are becoming increasingly clustered within fewer cities relative to the past, but there remains a key distinction to our American neighbours. The divergence in income and employment opportunities between cities has remained stable, in part due to greater labour mobility among Canadians3 and the contributions of high wage jobs within the goods-producing sectors. The greater breadth in the quality of jobs has, so far, mitigated the risk of inequality forming on that basis alone between Canadian cities. However, the U.S. still offers a cautionary tale. First, the challenges within Canada’s goods sector have been painfully obvious in the past two years and will have a harder time pushing against the strong regional momentum that forms from the digital economy. Second, Canada is at a much earlier phase of forming technology clusters, and regional characteristics are forming that create fertile ground for a similar American-style pattern to emerge with time. Overall, jobs are clustering within a handful of cities, which is further punctuated by the rapid ascent of tech employment. Just five cities – Toronto, Montreal, Vancouver, Ottawa and Calgary – account for approximately 70% of all digital services employment.
A proactive approach by policymakers can help spread the benefits of economic clustering across regions. However, care should be taken not to limit the dynamism of economic hubs while mitigating the inequality they can generate.
A Cautionary Tale: U.S. Geographical Sorting
Analyzing the forces that drive regional inequality requires an understanding of two terms: agglomeration economies and wage convergence. Let’s start with defining agglomeration economies. This refers to the concentration of similar companies, services, and industries within a localized geographical area. Firms locate within a narrow group of locations to benefit from deeper labour pools and/or access to common infrastructure. An intuitive example are major tech hubs such as Seattle, New York and the San Francisco Bay Area.
The second term, wage convergence, refers to the phenomenon where cities with initially higher average wages experience slower growth in those wages relative to cities with lower starting points. This dynamic places cities on more even footing by allowing ‘poorer’ cities to catch up to their richer counterparts. In turn, this mitigates regional inequality from forming or worsening. So, how does it work? A firm locates in a lower cost region with comparable access to labour resources. In effect, medium and high skilled job opportunities become embedded within these communities, which lifts the aggregate wage of the region. Conversely, lower skilled individuals seeking to improve their standard of living move into higher wage regions, which serves to lower that aggregate wage due to the shifting composition of jobs. The net effect is that economic opportunity is spread across geographies. As the analysis of Brookings pointed out, this interplay between firm location and the incentives they create in labour decisions was a hallmark within the U.S. economy from the post-war period until roughly 1980.4 Following that period, however, wage convergence between regions not only ceased playing out, but was thrown into reverse. Put another way, regional inequality worsened.
There is a natural strong incentive for firms to cluster in order to benefit from proximity and draw in a greater share of highly skilled (and highly compensated) individuals. In turn, larger economic hubs pull skilled workers out of smaller cities and rural areas through the lure of higher wages and more job opportunities. The outward migration of highly skilled workers causes those regions to gap further with peers in terms of wage and job opportunities because they subsequently reflect a disproportionate share of low wage opportunities. In turn, this depresses the aggregate income level of the area and perpetuates a cycle that influences the location decision of firms. Meanwhile, the high-skill migration to larger city hubs increases the cost of living in these productive regions, pushing low-wage workers out of the city perimeters in search of more affordable areas. Although lower wage workers may choose to move to the fringe of these sprawling metropolises, greater transportation costs impact their savings and discretionary spending, while also causing a negative externality via traffic congestion and commute times. For those lower wage workers who instead choose to remain within the city perimeters, they spend an even greater portion of their income on housing costs (limiting the availability of funds for other uses). Likewise, they can attempt to live in government subsidized housing, but this is often unattainable for many due to insufficient supply.5
And so, a negative feedback loop is reinforced whereby large cities succeed in attracting more and more high-skilled employers and smaller cities capture employers with lower skilled workers. Those smaller regions are at risk of weak home values, lower tax collection and reduced infrastructure utilization, making it unprofitable and/or inefficient to maintain. This ‘geographic sorting’ becomes a critical underpinning to income inequality.
Canadian Jobs Within a Handful of Cities
| Table 1: Canadian Census Metro Areas by Population | ||
| Group | CMA | Population 15 and Over (2018) |
| 1 | Toronto | 5,474,500 |
| Montreal | 3,480,300 | |
| Vancouver | 2,243,000 | |
| Calgary | 1,255,200 | |
| 2 | Edmonton | 1,169,400 |
| Ottawa-Gatineau | 1,156,600 | |
| Winnipeg | 689,400 | |
| Quebec | 685,500 | |
| 3 | Hamilton | 672,400 |
| Kitchener-Cambridge-Waterloo | 443,000 | |
| London | 442,300 | |
| Halifax | 368,700 | |
| Source: Statistics Canada, TD Economics | ||
The question now is whether Canada is mirroring the characteristics that can drive a regional wedge in employment and wage opportunities. To answer this, we followed the work conducted by the Brookings Institute and grouped the twelve largest Canadian metropolitan areas (CMAs) into three categories based on population size (Table 1). Employment shares were then calculated for these CMAs.
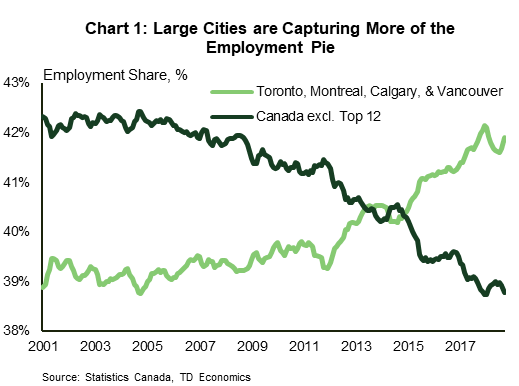
Following the financial crisis a clear ‘inverse’ dynamic took hold. Four cities (Toronto, Montreal, Vancouver and Calgary) went from having a stable share of employment hovering near 39% during the pre-crisis period, to a sharp acceleration (particularly noticeable from 2013 and onwards) to capture 42% of all employment. In contrast, those outside of the top 12 cities have seen their share of employment eroded from 42% to below 39% over the same period (Chart 1). In other words, the entire share of employment lost by cities not in the top 12 has been captured by four cities.
However, grouping cities in this manner masks some terrific employment growth by two CMAs not in the top four ranking. Since 2010, Edmonton and Kitchener-Waterloo-Cambridge (KWC) experienced employment growth of 24% and 20%, respectively. However, Edmonton’s contributions look to be a story of the past, where gains were concentrated within the periods of 2007 to 2009 and 2012 to 2013. In contrast, job opportunities in KWC have steadily climbed since 2009, aligning to a story of the present, and potentially the future.
| Table 2: Fastest Growing Sectors in Largest CMAs | ||
| CMA | Ranking of Change in Employment | Sectors |
| Toronto | 1 | Finance/Insurance/Real Estate/Leasing |
| 2 | Transportation/Warehousing | |
| 3 | Professional/Scientific/Tech Services | |
| Montreal | 1 | Transportation/Warehousing |
| 2 | Healthcare/Social Assistance | |
| 3 | Business/Building/Other Support Services | |
| Vancouver | 1 | Construction |
| 2 | Professional/Scientific/Tech Services | |
| 3 | Healthcare/Social Assistance | |
| Calgary | 1 | Healthcare/Social Assistance |
| 2 | Accommodation Food Service | |
| 3 | Transportation/Warehousing | |
| Source: Statistics Canada, TD Economics | ||
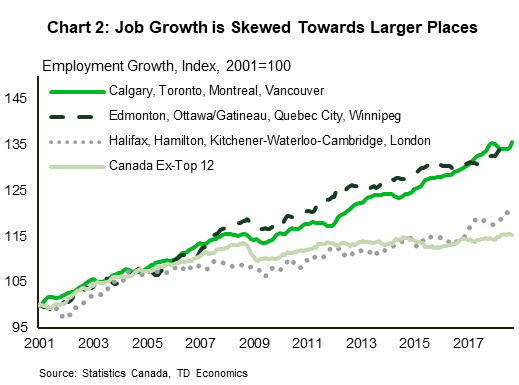
For the cities not in the top 12, the challenge is evident (Chart 2). From 2001 to 2005, job growth within the top 4 cities versus those in the non-12 group was growing at roughly the same rate. Thereafter, the opportunities began to steadily diverge. But, it wasn’t until after the global financial crisis that those smaller urban areas were left behind by their larger counterparts. The cumulative growth of jobs within cities outside of the top 12 has been just under 5% since the financial crisis, with little net new growth since the end of 2014.
So, large cities are getting larger, reinforcing the feedback loop between labour supply and employer location. This phenomenon mirrors that of the United States. What’s unique about the Canadian experience is that the greater geographic concentration has not yet been met by industry concentration. Employment opportunities continue to reflect a relatively broad group of sectors and this helps to mitigate the risk of having a narrow set of skills in demand (skills concentration). Table 2 shows the three sectors that have captured the most employment shares in the 2010-2018 period within those top four CMAs. Encouragingly, the employment rankings vary by city and are spread across both high- and low-skill sectors.
Canadian Wage Convergence is Waning

This geographic employment profile has likewise mitigated wage divergence. Average real wages in Canada are continuing to converge between regions, or at least not showing strong evidence of divergence.
We analyzed the compound annual growth rate of real wages from 1997 to 2018 against the level of the real wage for 33 Census Metropolitan Areas (CMAs).6 Unlike the U.S. experience, Canada reflects a negative relationship between the level of real wages in 1997 and the growth rate over the 1997 to 2018 period. This indicates wage convergence. Places that started out with a higher average real wage have experienced slower wage growth over the subsequent 20 years, while those with a lower starting point grew faster to ‘catch up’ to their richer counterparts.
However, the long time span masks a significant shift in employment dynamics post 2010. Truncating the sample to the period after the financial crisis (2010 to 2018) changes the narrative. First, the strength of the relationship between the level of income in 2010 and the subsequent growth rate has declined. Second, the gains in the goods-producing sector were a driving force behind the growth in real wages. Since 2010, this relationship has weakened. Finally, the emergence of the technology sector has become increasingly linked to stronger wage growth (for more detail, see Appendix A and B). All three of these ingredients create a recipe that could propel wage and employment inequality forces through the distinction of ‘have’ and ‘have-not’ cities within Canada. This is the cautionary tale that drew our attention from observations of the U.S. experience.
Changes in the composition of jobs within Canadian cities is already leaving its mark on slowing down wage convergence dynamics. To demonstrate, we placed cities into three groups based on their 2003 wage ranks (high, medium and low).7 Next, we calculate how the composition of employment and wages in these locations changed over the 2003-2010 period.8 Cities that were in the bottom group in 2003 had real wages in 2010 that were roughly 0.7% higher than they otherwise would have been had the composition of employment not changed. Meanwhile, for those in the top and middle groups, the compositional shifts resulted in wages that were lower by 0.9% and 1.4%, respectively. We repeated this exercise for the 2010-2018 time period, with the results reinforcing that compositional shifts in employment have ceased to produce the gains in average wages that benefited low wage cities in the past. This is consistent with the cursory findings that the goods producing sector has stopped being a key determinant of wage growth, which presents a cautionary development. If the past wage convergence was determined in part by labour shifting to the higher paying goods producing sectors, its diminishing role in wage determination will limit the avenues by which CMAs can catch up to their richer counterparts. In a practical sense, the booms in the construction and commodity sectors that had previously helped to lift the fortunes of lower income regions have trailed off, and with them, so too has wage convergence.
A Cautionary Tale: Rising Tech Hubs Can Step Into The Gap To Create Wage Divergence

Furthermore, what’s been stepping into this gap is the growing influence of the technology sector. This can accentuate wage divergence between Canadian cities if job hubs form with increasing geographic concentrations, as seen in the United States. Just 10 of the U.S.’s largest metropolitans account for about half of all digital services jobs, even though they represent only one-quarter of the U.S. population (Chart 3).9 And, an even smaller number of metros have increased their share of digital services jobs in any significant way since the financial crisis. Among the top 50 U.S. metropolitan with the highest absolute number of persons employed in digital services, just five — San Jose, San Francisco, New York, Austin, and Tampa — accounted for 36% of the growth in digital services employment between 2010 and 2016 (Chart 4). In contrast, 78% of the nation’s largest 100 metros either had no movement in their share of national digital services employment or saw it shrink.
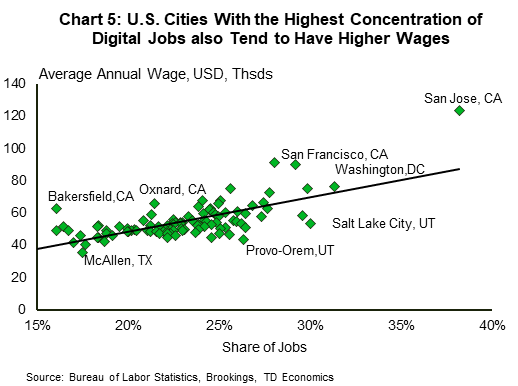
The geographic concentration of high skilled digital jobs ends up driving a wedge in wages with those cities that fail to keep up. Data by Brookings revealed that the U.S. metros with the highest concentration of the skilled digital jobs also had higher overall annual wages for their other jobs. There was, in fact, a positive relationship between the degree of digital services concentration within a city and wages (Chart 5). This suggests that digital workers in cities characterized as hubs of tech activity are earning more than similarly qualified workers in other areas of the country. So even among tech workers, a widening wage divide is likely to exist between cities that are hubs versus smaller tech metros.10
Will Canada Replicate the U.S. ‘Digital Divide’?
In comparison to many of their U.S. counterparts, large Canadian cities such as Toronto, Ottawa, Montreal and Vancouver offer significant value to tech firms with relatively cheaper labour (Chart 6) and real estate costs (Chart 7), but equivalent quality in terms of a well-educated workforce. This reality could foster significant tech sector growth in these major metropolises. Should it occur in the absence of offsetting factors (like we’ve seen in the past via well-paying jobs in other sectors of the economy), regional inequality would become more apparent with time.

To make our Canadian analysis comparable to the U.S., we zoom in on a specific group of tech workers – those employed within the digital services sector. For clarification, digital services is a sub-group of tech industries.11 By this measure, Canada’s tech workforce was just over 407,000 in 2018, accounting for 2.6% of total employment. Under the broader measure beyond digital services, tech employment accounted for approximately 5.8% of the Canadian workforce. Regardless, both of these figures are highly similar to the U.S. at 2.4% and 6.2%, respectively.

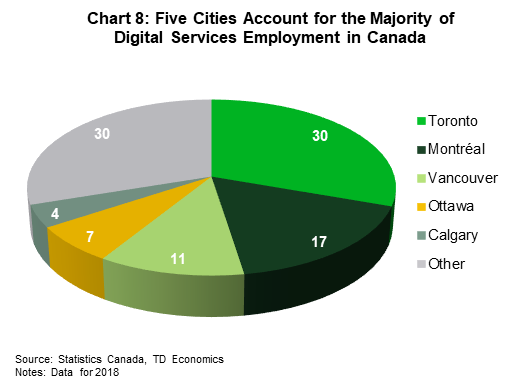
Within Canada, almost 70% of these digital services jobs were located in just five cities, suggesting similar markings of geographic concentrations as that evident south of the border (Chart 8). Toronto, in particular, has been the leading destination for tech talent. Commercial real estate firm CBRE estimates that between 2012 and 2017, Toronto gained over 55,000 tech jobs (the highest of any metro examined) versus the San Francisco Bay Area, which gained about 46,000 (the second highest). In 2017 alone, Toronto was the fastest growing tech jobs market. It was ranked as the fourth-best tech talent market in North America and, in its downtown core, tech businesses accounted for more than one-third of the demand for office space.
However, one important notable difference to the U.S. is that these five cities account for over 43% of Canada’s total population, whereas the top five tech cities in the U.S. represent a mere 14% of their population. So the diffusion of tech jobs is in fact broader than the simple city metric reveals. In addition, the dominant five Canadian cities are facing some new competition. Kitchener-Waterloo-Cambridge (KWC) is a rising tech superstar city that saw digital services employment grow by almost 130% during the 2010-2018 period, which doubled the share of workers to 4.7% of the total job market. The rapacious pace of growth in KWC offers hope for implementing programs to foster similar outcomes in other relatively small urban locations that are at risk of being left behind in the tech wave. However, the ingredients are not easy to replicate, as KWC has a unique advantage as a university hub that may mark the exception, rather than the rule when compared to other regions.
The Wage Premium of Tech Hubs and Jobs
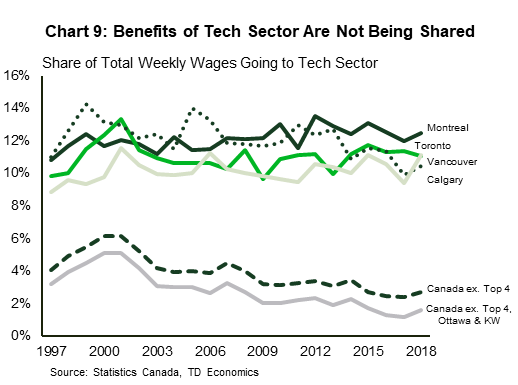
Like the U.S., Canadian tech hubs exhibit a wage premium for tech workers relative to non-tech workers that is larger than other cities in the country. The premium in Canada, however, is not as extreme as those observed in the U.S. We calculated the share of total wages being paid to tech sector workers in any geographic area. Chart 9 shows that outside of a handful of CMAs, the share of tech sector wages in the majority of cities has been trending down. In other words, the benefits of the technology sector are increasingly being accrued by workers located within a specific subset of the economy.

This is punctuated by the fact that the average annual real wage for Canadian workers in the more targeted digital services sector was $53,700 in 2018. This is roughly $15,700 more than other jobs within the country absent this group of skilled workers. In addition, relative to digital workers in other locations, those in the group-of-five cities exhibited a further wage premium (Chart 10).

Within each province, digital services workers in tech hub cities generally earned more than the average income for all digital services workers located elsewhere in the province (Chart 11). This further reinforces a regional divide. However, here too, the evidence is not as extreme as that south of the border. In fact, Toronto and Vancouver are the exceptions to the rule, and these two cities are located in provinces that make up more than a half (52%) of the national workforce. It’s uncertain, however, if this relationship can persist. The high cost of living in Toronto and Vancouver means that wages do not go as far. As we noted earlier in this report, a natural dynamic of a deepening cluster of high skilled and high wage workers within a city is to drive up housing and living costs, push out lower skilled workers and push up wage-demand from those who remain within the tech cluster zones (see Appendix C, Box 2). To this point, even non-tech workers earn higher-than-average wages in the tech-hub cities relative to their peers in other cities.
Immigration Can Influence the Outcome

Regional inequality from a concentration of tech jobs within cities is not a forgone conclusion. Mitigating factors can take many forms, including increased labour supply. For Canada, the obvious pathway is through highly skilled immigrants that may be helping to delay, if not avert, the U.S. outcome of wage divergence.
There is a high degree of immigration to Canadian tech cities. In 2018, Toronto and Vancouver attracted 33% and 11% of all immigrants, respectively. In fact, approximately 62% of all immigrants went to the top four cities which are tech hubs (Toronto, Montreal, Vancouver and Ottawa). In contrast, the top four tech cities in the U.S. (New York, Washington, San Francisco and San Jose) only accounted for about one quarter of all U.S. immigrants in 2016 and the top ten accounted for 45%. Additionally, immigrant selection in Canada tends to be more skills-based than it is in the United States.12
These underlying forces help to generate greater availability of skilled labour in Canadian tech cities, which in turn helps to restrain the growth in the wage premium.13 We believe this is one of the reasons why Toronto and Vancouver proved the exception in the data. In these cities, the real wage premium to digital services workers did not exceed the provincial average; in contrast to other tech cities. So while the increasing appeal of some Canadian cities as a tech hub would lean towards greater divergence, immigration may serve as a counterweight, thereby delaying that outcome.
However, there’s no denying that the seeds that drive regional inequality have been planted and can flourish if left unchecked. Most tech jobs in Canada are projected to grow faster than other opportunities within the nation (Chart 12). If these jobs continue to be concentrated in the top four metros that already account for the bulk of digital services employment, then the income inequality created through geographic sorting may become harder to restrain over time. This can become a challenge for not only policymakers, but also tech companies.
Mitigating Forces of Regional Inequality
Since there is an economic tendency for tech jobs and wages to drive growth in a few places while providing too little growth elsewhere, it’s important for policymakers to understand its workings and transition mechanism.
These strategies should acknowledge the dynamism and efficiency which are conferred by an agglomeration economy, that is, the benefits of clustering of “like” industries. Rather than seeking to stifle such dynamics, opportunities should be sought to extend them to more regions by implementing the conditions and growth drivers which encourage convergence with the rising superstar cities. Implementing such strategies can at least partially mitigate unevenness, even as more clustering in more diverse places can maximize total future innovation and economic output.
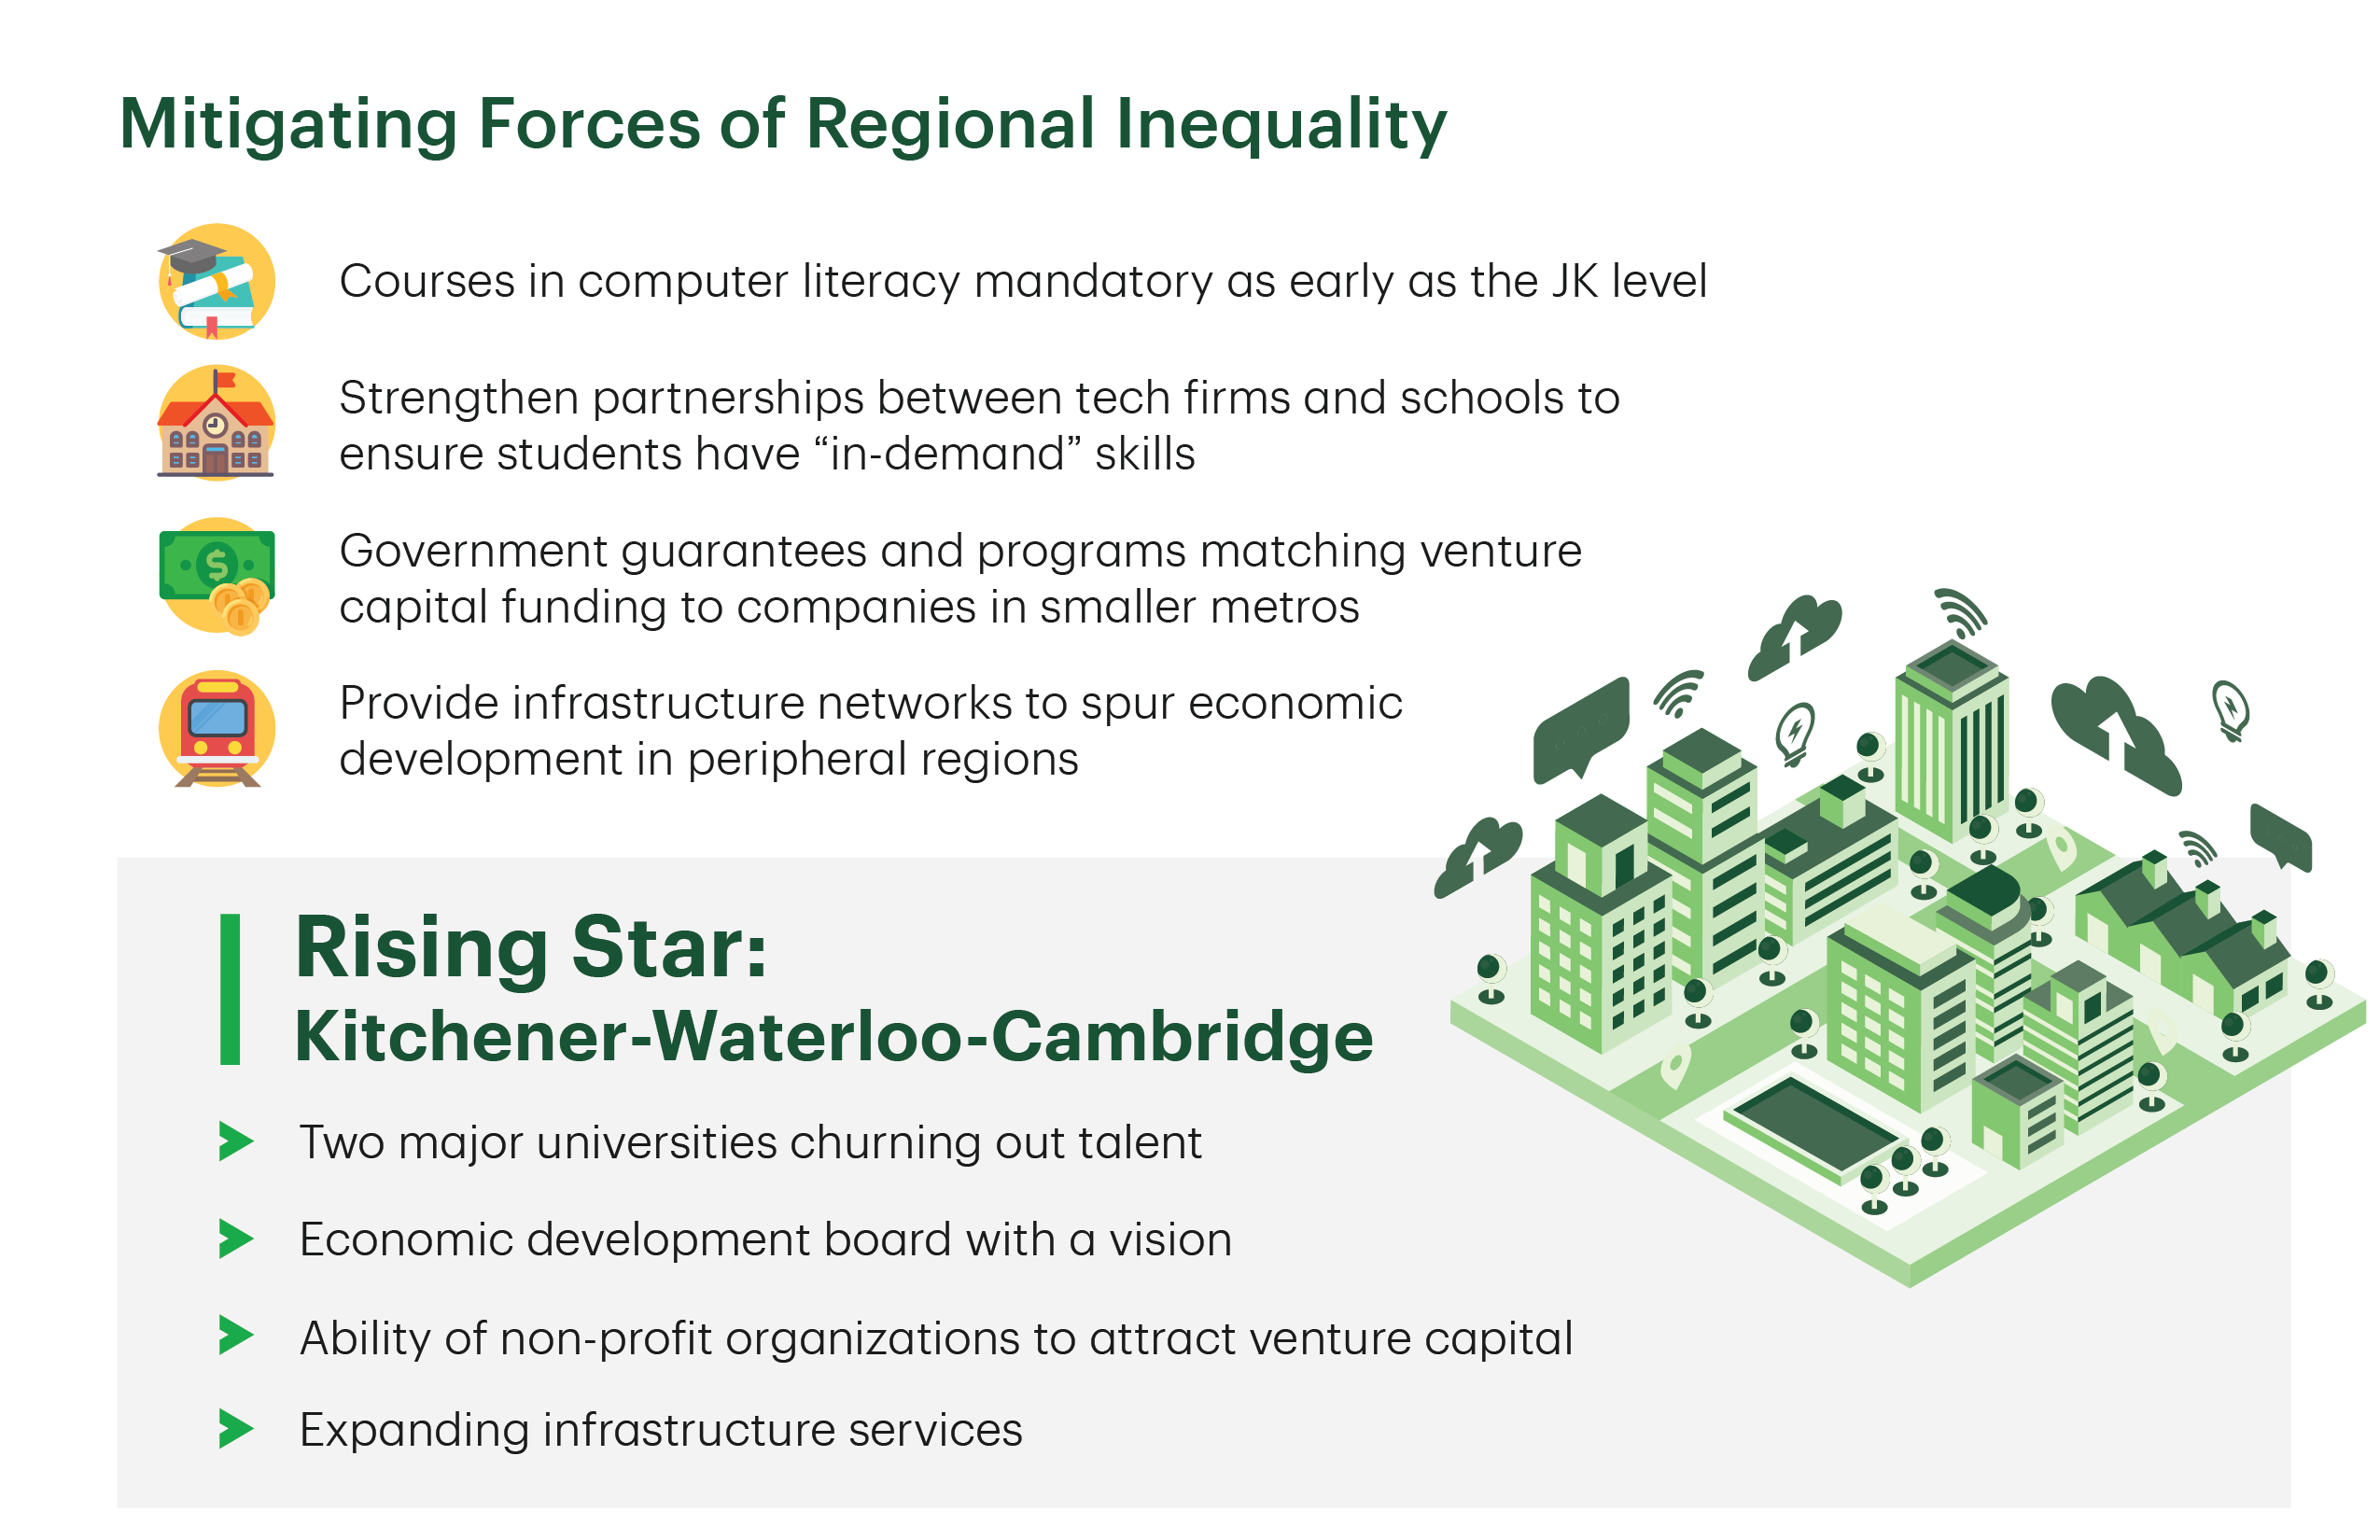
To take advantage of these opportunities, workers and the prospective cities themselves need to be prepared to implement strategies specifically aimed at expanding the skills of the workforce, the capital base and the access of lagging communities to rapidly changing new technologies. In a highly non-exhaustive list, possible areas of consideration include:
- Making courses in computer literacy and digital technology mandatory as early as the JK level.
- Strengthening partnerships between tech firms and institutions of higher learning to help ensure that students enter the workforce with ‘in-demand’ skills. Not only will students acquire basic digital skills which are a prerequisite to functioning in today’s highly digitalized world, but they will also gain higher order skills which are in demand at these firms.
- Alongside a suitably trained workforce, accessible capital is needed to fund start-ups and to scale already established tech businesses. Venture capitalists are generally drawn to the already established tech hubs and lending to startups is a riskier proposition for conventional loan sources. Programs that mitigate these risks, such a government guarantees, and help to match venture capital funds with these startups are worth exploring. Canada already has a few such programs in place, however awareness of them among tech entrepreneurs could help optimize utilization.
- Also important is the provision of adequate infrastructure (transportation networks, well equipped training institutions etc.) in smaller cities that can act as a catalyst for greater economic development.
The transformation of Kitchener-Waterloo-Cambridge in southern Ontario is an example of some of these principles at work. The region with a little more than half a million residents has gained a global reputation as an emerging technology hub through a confluence of factors. Namely, the talent of its workforce churned out by two major universities, the ingenuity of non-profit organizations to woo venture capital to budding tech companies in the area and an economic development board with a vision and plan for transformation. Of note, there has been laudable focus on KWC’s infrastructure development in recent years (light rail transit, expanding train connections to Toronto, downtown core redevelopment etc.). This is welcomed and had such extensive focus been implemented even sooner, then the buoyant growth currently being experienced may have been kick-started even earlier.
While it may be impractical, if not impossible, to rescue every left-behind enclave, proper targeting of polices does have the potential to lift some promising regions. Emerging super-star cities close to regional areas that are falling behind can serve as an epicenter to spur greater tech accessibility for those communities. In fact, this is a less daunting task for Canada than the United States because of the high population concentration along the southern border. Within only a 200 kilometer radius to each of our five emerging Canadian super-star central metropolitan areas, resides roughly 60% of the total population. This compares to 26% of the U.S. population located within the same distance to their top five digital centers. The net can be cast widely in Canada with targeted strategies.
Policies can involve direct federal investment in promising small cities, giving them special designations as “Emerging Tech Hubs”. These cities, which in themselves must possess the seeds to be transformed into a tech center, would oversee the implementation and management of the various public-private partnerships that are vital to development and expansion of tech infrastructure. Prerequisites for this designation would include features such as education and training institutions, a viable transportation network (possibly including air transport), and the propensity to become a home for various advanced-sector industries. The aim of the initial public funding of programs in such cities is to create critical mass, which can then proceed under its own momentum to eventually require no further government financing.
In short, policy should not focus on slowing or detracting from growth in the innovative tech sector, but rather on attenuating its negative effects and spreading its benefits. To combat the geographic sorting of workers by skill level for example, improvements in the public transit system can play a significant role. Commuting considerations are one of the important factors which influence workers decisions about job and living location. Since lower paid workers often cannot afford the high cost of living in cities with highly paid tech workers, they may choose to live further out in less economically affluent communities. If the supply of affordable housing options cannot readily be increased in major cities, improved transportation systems can synthetically increase the supply of housing and enhance the employment opportunities for households living in the more geographically isolated neighborhoods.
Also important are the tech workers, currently working in these tech hubs who want to leave the cities, but not necessarily their jobs or careers. Increased reliance on telecommunication facilities, remote work, flexible workweeks, job share and other innovative personnel management practices by tech firms could allow such workers to live in more geographically dispersed communities. In this way, smaller metros and rural areas can still benefit from the digital wave, even if they themselves cannot directly support high tech industries.
Bottom Line
Even if technology is not a primary driver of slowing labour market convergence and geographic inequality, it certainly is a contributory factor, which will gain in importance as our world becomes even more digitalized. In effect, the spatial dimension of economic inequality within countries has been highlighted by this transition to a digital economy. If not adequately addressed, the negative effects of increasing digitalization will only grow.
Widening gaps between regions result in a worse-off outcome for both workers and firms who stay in the lagging regions, as well as those who live in the thriving metropolises. Workers in lagging regions miss out on opportunities for gainful employment at high-productivity frontier firms and instead may face unemployment or underemployment. The communities suffer from a lack of high growth businesses along with the taxes and dynamism they provide. On the flipside, workers in bustling tech cities may suffer from burnout, traffic congestion and a high cost of living (particularly housing), while firms struggle to find a sufficient number of workers. The dichotomy is not likely to come to a socially or economically optimal outcome on its own. In an age and industry where agglomeration economics rule, the lower costs of lagging regions are no longer sufficient on their own to attract successful firms and workers from tech hubs. Instead, a kind of clustering dynamic is fostering the desire of top firms to be where other top firms are.
This has been the experience in the U.S. and to a lesser extent Canada. Given Canada’s attractiveness as a tech location, policies need to be put in place which will allow a diverse range of communities to benefit from the agglomeration dynamics of tech industry growth. The dynamics need to spread beyond the current small group of digital driver cities to other cities and communities, so that they too may participate fully in all that a digitally driven economic expansion has to offer.
Appendix A
Box 1: The Evolving Relationship between the Goods Producing Sector and Wages
We run three sets of regressions14 with the compound annual growth rate of real wages as the dependent variable. First we run a regression of the logarithm of the level of wages against the growth rates and examine the coefficient.15 The regression results are presented in Columns 1 and 4 of Table 3.16 We see that the coefficient is negative in both cases, as would be expected, and indicates convergence between high and low wage CMAs.
To adjust for the effect of changes in the composition of employment we add additional explanatory variables to the convergence regression. Columns 2 and 5 augment the basic regression by adding the change in the share of employment in the goods producing sector as an explanatory variable.17
The effect of the changes in the goods producing sector over the two samples is stark. From 2001-2018 changes in the employment share are meaningfully correlated with the growth rates in real wages. Over this period commodity producing regions experienced strong wage growth while the industrial heartland experienced slower growth in real wages with a rapidly declining manufacturing sector. However, over the latter period this effect becomes much smaller, and indeed, we can confirm this as the coefficient on the starting point of the real wage is pretty much unchanged by its addition to the regression equation (Columns 4 and 5).
Given that one of the main drivers of regional wage convergence has weakened over the last 10 years, it is no surprise that the strength of the relationship between the level and subsequent growth rate of wages has weakened.
What the new drivers of convergence patterns are remain to be seen. One possibility though is the increasing role of the technology sector in the economy. Using Statistics Canada data we compute the share of employment in a subset of highly tech oriented industries in the 33 CMAs under study.18 We then add the change in the employment share of these industries as a covariate to the convergence regressions. These results are presented in Columns 3 and 6. Over the entire sample the effect of tech employment share is small, however, over the latter part of the sample, the effect of tech employment has become more correlated to changes in wage growth (Column 6 , Table 3).
| Table 3: Compound Annual Growth Rates as Dependent Variable | ||||||
| 2001 - 2018 | 2010 - 2018 | |||||
| Explanatory Variables | 1 | 2 | 3 | 4 | 5 | 6 |
| log (Real Weekly Wage Base Year) | -0.047 | -0.024 | -0.013 | -0.026 | -0.023 | -0.019 |
| p-value | 0.005 | 0.073 | 0.383 | 0.186 | 0.2351 | 0.302 |
| Change in share of goods sector employment | 0.055 | 0.059 | -0.036 | -0.035 | ||
| p-value | 0.0 | 0.0 | 0.16 | 0.149 | ||
| Change in share of digital sector employment | 0.055 | 0.146 | ||||
| p-value | 0.089 | 0.043 | ||||
| Source: TD Economics | ||||||
| Appendix B: Goods Producing Sectors Are Better Compensated | ||||
| 2010 | 2018 | |||
| Canadian Wages by Sector | Median Hourly Wage | Rank | Median Hourly Wage | Rank |
| Utilities | 32.42 | 1 | 40.00 | 1 |
| Forestry, Fishing, Mining, Oil and Gas | 28.48 | 2 | 35.71 | 2 |
| Public Administration | 28.37 | 3 | 34.48 | 3 |
| Educational | 26.92 | 4 | 30.77 | 4 |
| Professional, Scientific and Technical Services | 25.00 | 5 | 30.00 | 5 |
| Construction | 22.50 | 6 | 27.00 | 6 |
| Finance, Insurance, Real Estate and Leasing | 21.18 | 8 | 26.92 | 7 |
| Transportation and Warehousing | 21.50 | 7 | 24.00 | 8 |
| Healthcare and Social Assistance | 20.77 | 9 | 24.00 | 8 |
| Manufacturing | 20.15 | 10 | 23.06 | 10 |
| Information, Culture and Recreation | 19.23 | 11 | 21.00 | 11 |
| Other Services | 16.00 | 12 | 20.00 | 12 |
| Business, Building and Other Support Services | 14.42 | 13 | 17.80 | 13 |
| Agriculture | 13.00 | 15 | 17.00 | 14 |
| Trade | 13.50 | 14 | 16.50 | 15 |
| Accommodation and Food Services | 10.95 | 16 | 14.00 | 16 |
| Goods Producing Sectors | 22.00 | 25.48 | ||
| Service Sectors | 19.00 | 22.42 | ||
| Source: Statistics Canada, TD Economics | ||||
Appendix C
Box 2: Housing Markets and Regional Concentration
The increased clustering of employment in the four largest cities in the country harkens back to work by Giannone (2017) on skills biased technical change, agglomeration effects and regional divergence in the United States. Research by the Bank of Canada provides evidence that Canadian non-university graduates are even less mobile than their American counterparts. This fact, combined with the increased clustering of the economy in a few large cities points to a potential for diverging outcomes.
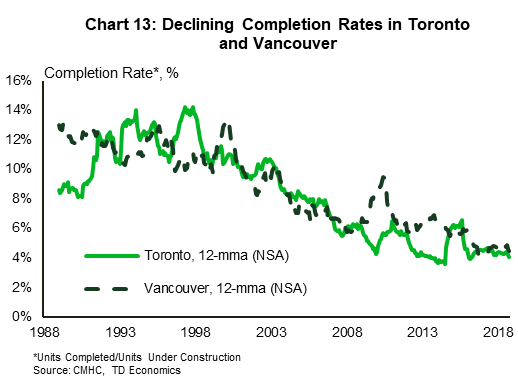
As Ganog and Shoag (2016) pointed out, housing affordability plays a large role in wage divergence and migration decisions, and here Canada has historically maintained an elastic housing supply.19 However, completion rates on residential construction projects in both Toronto and Vancouver, have declined substantially from highs in the 1990’s and early 2000’s (see Chart 13).20 This is relevant because the BoCs analysis, which showed a more elastic supply of housing in Canada, was limited to the period from 1990-2011. The structural shift that has occurred, and persisted, could indicate a prolonged period of less responsive housing supply, putting upward pressure on Canadian housing prices in response to labour demand shocks. This erosion of real incomes could profoundly affect the migration decisions of workers in the economy. Given both Toronto and Vancouver’s growing role in the labour market, and in the technology sector, the large increase in housing prices in 2016 and 2017 may very well be helping sow the seeds of divergence in Canada.
| Appendix D: Ranking of CMA by Real Wage | |
| 2003 | |
| 1-11 | (1) Ottawa-Gatineau, ON/QC, (2) Oshawa, ON , (3) Hamilton, (4) Windsor, (5) Toronto, ON, (6) Vancouver, BC, (7) Guelph, ON, (8) Calgary, AB, (9) Barrie, (10) London, ON, (11) Greater Sudbury, ON |
| 12-22 | (12) Kitchener-Waterloo-Cambridge, ON (13) Regina, SK (14) Edmonton, AB, (15) Thunder Bay, ON, (16) Victoria, BC (17) Kingston, ON, (18) Kelowna, BC, (19) Saguenay, QC, (20) Montreal, QC, (21) Quebec, QC, (22) Peterborough, ON |
| 23-33 | (23) Abbotsford-Mission, BC, (24) Brantford, ON, (25) St. Catherine's Niagara, ON, (26) St. John's, NL (27) Winnipeg, MB, (28) Halifax, NS, (29) Saskatoon, SK, (30) Trois Rivieres, QC, (31) St. John's, NB, (32) Sherbrook, QC, (33) Moncton, NB |
| 2018 | |
| 1-11 | (1) Ottawa-Gatineau, ON/QC, (2) Edmonton, AB, (3) Calgary, AB, (4) Regina, SK, (5) Oshawa, ON, (6) Victoria, BC, (7) Greater Sudbury, ON, (8) Barrie, ON, (9) Hamilton, ON, (10) Vancouver, BC, (11) Kitchener-Waterloo-Cambridge, ON |
| 12-22 | (12) Kelowna, BC, (13) Toronto, ON, (14) Saskatoon, SK, (15) St. John's, NL, (16) Quebec, QC, (17) Kingston, ON, (18) Guelph, ON, (19) Montreal, QC, (20) Windsor, ON, (21) Abbotsford-Mission, BC, (22) Thunder Bay, ON |
| 23-33 | (23) Saguenay, QC, (24) Peterborough, ON, (25) Brantford, ON, (26) London, ON, (27) Trois Rivieres, QC, (28) Halifax, NS, (29) Winnipeg, MB, (30) St. John, NB, (31) Sherbrook, QC, (32) Moncton, NB, (33) St. Catherine's - Niagara, ON |
| Source. Statistics Canada, TD Economics | |
End Notes
- The growing regional disparity between American cities has been noted by the Brookings Institute and others. See references: 1,2,3,5,6,7
- These cities were hard-hit by the decline of America’s manufacturing sector. Some have not been able to successfully transform themselves in an increasingly digital era. Others, which have been able to transform, still often lose out on tech investment to more established tech cities, resulting in a notable investment gap between themselves and the quintessential tech hubs.
- See Albouy D., Chernoff A., Lutz C., and C. Warman (2019).
- Brookings report – Digitalization and the American Workforce
- The effects of land use restrictions, their transmission to housing costs and worker location are addressed in Ganong and Shoag (2017).
- Using data provided by Statistics Canada we deflate the nominal weekly wage by the CPI for the corresponding CMA or, in cases where the CMA CPI is unavailable, by the provincial CPI.
- We employ Labour Force Survey (LFS) data and group the 33 CMAs under study into three groups of 11 CMAs based on average weekly wages in 2003 (Appendix D)
- Data of wages by sector at the CMA level are unavailable, so we applied the provincial wages by sector as a proxy. Admittedly, this glosses over some of the intra-provincial wage differentials across CMAs but we are looking to capture differentials across sectors anyway. For example, a construction worker in Vancouver may make more than a construction worker in Abbottsford, but the difference between the wage of the construction worker in Vancouver and a waiter in Vancouver is what we are looking for. The assumption we are forced to make is that the differences within each CMA are broadly similar. BoC research finds that inequality grows with population, but again, data limitations here force our hand to calculate a ‘best guess’ for this measure.
- Digital services is defined by the aggregates of the following four NAICS 4-digit industries: 5112 Software Publishers, 5182 Data Processing, Hosting, and Related Services, 5415 Computer Systems Design and Related Services, and 5191 Other Information Services.
- See footnote 4.
- The tech sector is defined by eighteen 4-digit NAICS industries and digital services by a sub-group of four 4-digit NAICS industries to maintain consistency with the definition employed by Brookings.
- Ontario’s government recently announced that it will seek to implement a new dedicated immigration stream for tech workers, though details beyond this have not been provided. The US, in contrast, has limited the number of visas available for skilled workers.
- Research by the Bank of Canada also found that Canadian immigrants are more responsive to local labour market conditions than their U.S. counterparts. See “Local Labor Markets in Canada and the United States”.
- The purpose of the exercise is to determine if there are some general trends manifesting themselves in the data in order to provide some guideposts for our analysis. White’s test for heterscedasticity was applied to all regressions. Column 3 fails to reject the null of homoscedasticity and standard errors are estimated with heteroscedasticity robust standard errors.
- See, Giannone, E. (2017): “Skilled-Biased Technical Change and Regional Convergence,”: https://home.uchicago.edu/~elisagiannone/files/JMP_ElisaG.pdf, or Ganong, P., and D.W. Shoag, (2017): “Why has Regional Income Convergence in the U.S Declined?”, NBER Working Paper Series Working Paper 23609, http://www.nber.org/papers/w23609
- The constant in all regressions is omitted from the table.
- As a check for multicollinearity, the Variance inflation factor for the income variable is less than 5.
- The tech industry is defined by the aggregate of eighteen NAICS 4-digit industry codes.
- See, Albouy, D., Chernoff, A., Lutz, C. and C. Warman (2019) “Local Labor Markets in Canada and the United States” Bank of Canada Staff Working Paper 2019-12
- Those in Montreal and Calgary show no discernable pattern change.
References
- Where You Should Move to Make the Most Money: America’s Superstar Cities. https://www.wsj.com/articles/where-you-should-move-to-make-the-most-money-americas-superstar-cities-11544850010
- Gyourko, J., Mayer, C. and T. Sinai (2013) “Superstar Cities” American Economic Journal: Economic Policy, 5(4), 167-199
- Superstar Cities Have a Big Advantage in Attracting High Paying Jobs: https://www.economist.com/finance-and-economics/2018/11/17/superstar-cities-have-a-big-advantage-in-attracting-high-paying-jobs
- Countering the Geography of Discontent: Strategies for Left-Behind Places – Brookings (2018)
- Ganong, P., and D.W. Shoag, (2017): “Why has Regional Income Convergence in the U.S Declined?”, NBER Working Paper Series Working Paper 23609, http://www.nber.org/papers/w23609
- Giannone, E. (2017): “Skilled-Biased Technical Change and Regional Convergence,”: https://home.uchicago.edu/~elisagiannone/files/JMP_ElisaG.pdf
- Albouy D., Chernoff A., Lutz C., and C. Warman (2019) “Local Labor Markets in Canada and the United States” Bank of Canada Staff Working Paper 2019-12
Disclaimer
This report is provided by TD Economics. It is for informational and educational purposes only as of the date of writing, and may not be appropriate for other purposes. The views and opinions expressed may change at any time based on market or other conditions and may not come to pass. This material is not intended to be relied upon as investment advice or recommendations, does not constitute a solicitation to buy or sell securities and should not be considered specific legal, investment or tax advice. The report does not provide material information about the business and affairs of TD Bank Group and the members of TD Economics are not spokespersons for TD Bank Group with respect to its business and affairs. The information contained in this report has been drawn from sources believed to be reliable, but is not guaranteed to be accurate or complete. This report contains economic analysis and views, including about future economic and financial markets performance. These are based on certain assumptions and other factors, and are subject to inherent risks and uncertainties. The actual outcome may be materially different. The Toronto-Dominion Bank and its affiliates and related entities that comprise the TD Bank Group are not liable for any errors or omissions in the information, analysis or views contained in this report, or for any loss or damage suffered.
Download
Opinion Editorial
Share this: