2026 Alberta Budget
Testing the Fiscal Framework
Marc Ercolao, Economist | 416-983-0686
Date Published: February 26, 2026
- Category:
- Canada
- Government Finance & Policy
Highlights
- Alberta is projecting a $9.4 billion deficit in FY 2026 27. A cumulative shortfall of almost $24 billion is now expected across the 3-year forecast horizon.
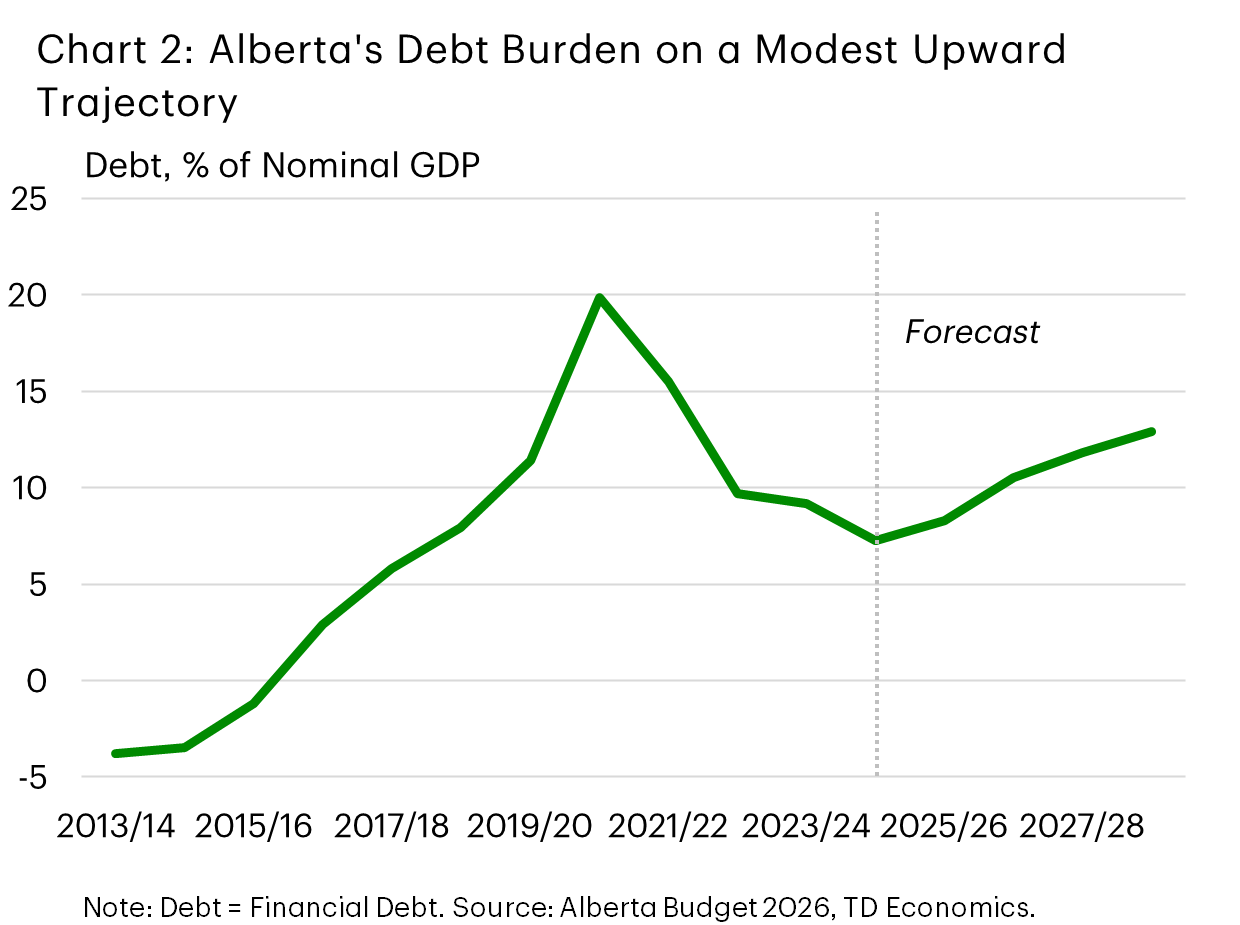
- Net debt to GDP is expected to turn higher to 10.5% in FY 2026 27, and to nudge upward to 13% by FY 2028 29.
- Weaker oil prices drive revenue softness, while modest tax measures and spending restraint help, but do not restore balance within the horizon.
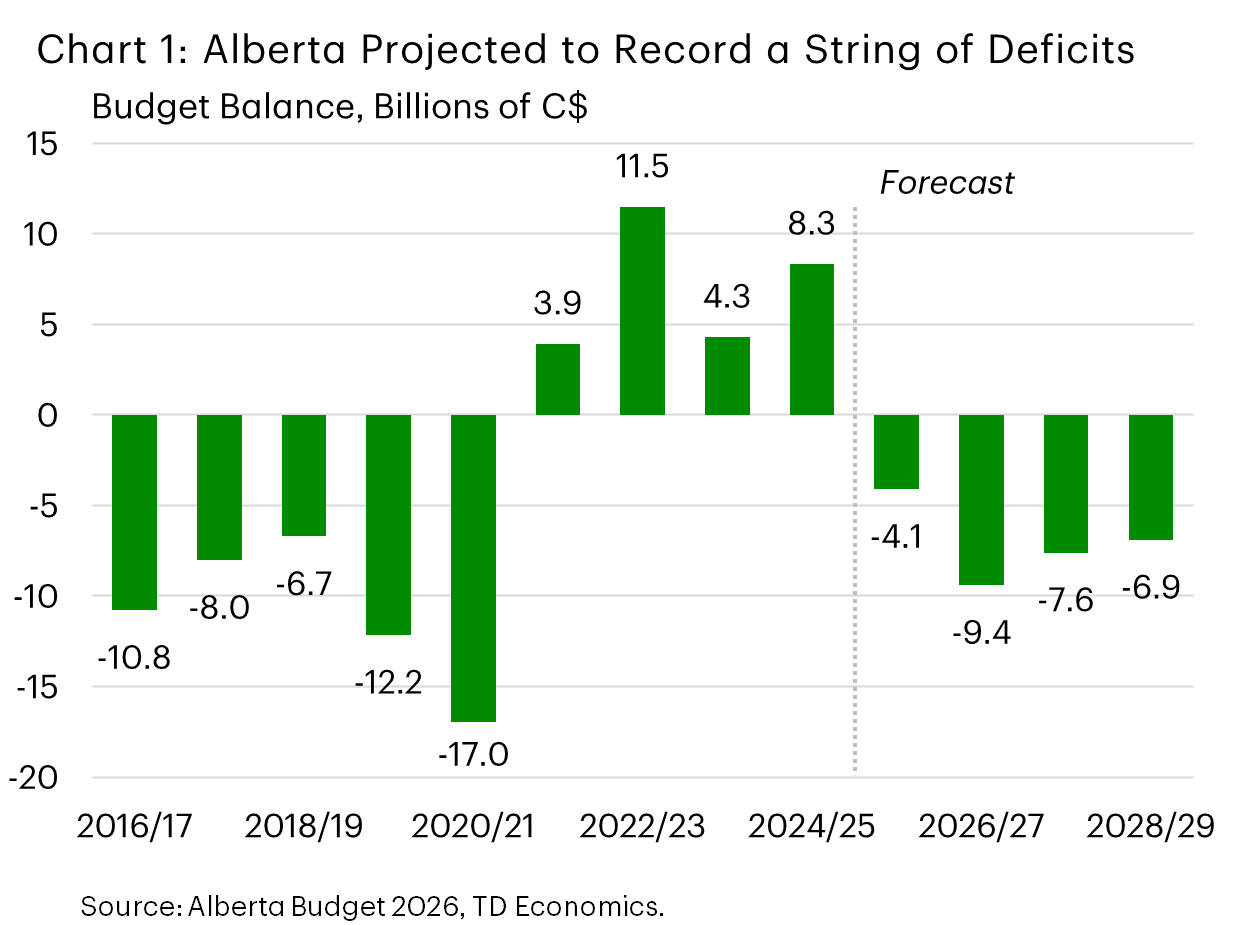
Alberta’s budget deficit is slipping deeper into red ink. The government is now projecting a $9.4 billion shortfall in FY 2026 27 (equivalent to 1.9% of GDP), following a revised FY 2025 26 deficit of $4.1 billion. Unlike last year’s budget, this plan does not chart a return to balanced books. Omitting a path to balance runs counter to Alberta’s Sustainable Fiscal Planning and Reporting Act, which requires the government to return back to balance within a three year window. Budget 2026 promises a review of the fiscal framework and cites softer energy revenues, global uncertainty, and population-driven cost pressures as the drivers of the deficit path. Other anchors, such as holding operating spending growth to inflation plus population, remain within the legislated ceiling.
Policy choices in this budget are measured. No broad based tax hikes are introduced, but the budget introduced a number of targeted revenue measures (notably a 6% vehicle rental tax effective January 2027, education property tax adjustments, a tourism levy and other user pay items), alongside some spending restraint. Further, the contingency allowance is set at $2 billion per year, cut by almost half compared to what was put in place last year.
Softer Near Term Growth and Oil Prices Weigh on Revenues
The government expects Alberta’s economy will slow in 2026 as population growth cools and global trade uncertainty lingers. Real GDP is forecast to expand by 1.8% in 2026, before picking up to 2.3% in 2027. Nominal GDP growth, a better proxy for the revenue intake, is forecast to be muted in 2026 (~1.9%) amid lower energy prices, then rebound to 6% next year. The government’s assessment of the economic outlook broadly aligns with our view, although their projections indicate marginally higher nominal growth for 2027 than ours.
This weaker backdrop feeds directly into the top-line outlook, with FY 2026 27 revenues forecast to dip by 0.9% before recovering back to 4.5% growth (on average) over the outer years of the forecast. Energy revenues drive the bulk of the near-term decline. The budget assumes WTI prices average US$60.50/bbl in FY 2026 27, marking a $10/bbl drop from last year’s projection. That downgrade, alongside a wider heavy-oil discount, yields a near-25% drop in bitumen royalties. The projection for WTI prices to rise to US$67/bbl average by next year reasonably incorporates known risks. Every $1 move in WTI (and $1 improvement in the differential) are expected to impact total revenues by a combined $1.35 billion. Interestingly, that sensitivity was marked down by around $150 million per dollar relative to the prior budget.
Meanwhile, an ~8% bump in personal income tax and 1.1% increase in federal transfers is expected to soften the blow on the total take. Corporate income tax is assumed to be roughly in the near term amid trade and price headwinds.
Alberta Economic Assumptions
[ Percent Change Unless Otherwise Noted ]
| Budget 2026 | |||||
| Calendar Year | 2025E | 2026F | 2027F | 2028F | 2029F |
| Nominal GDP Growth | 1.5 | 1.9 | 6.0 | 4.4 | 4.4 |
| Real GDP Growth | 2.2 | 1.8 | 2.3 | 2.2 | 2.2 |
| CPI Inflation | 2.0 | 2.1 | 2.1 | 2.1 | 2.1 |
| Employment Growth | 2.8 | 1.9 | 2.0 | 1.9 | 1.8 |
| Population Growth | 2.5 | 1.1 | 1.1 | 1.4 | 1.4 |
| Fiscal Year | 25-26E | 26-27F | 27-28F | 28-29F | - |
| WTI Oil (US$/Barrel) | 61.5 | 60.5 | 67.0 | 67.5 | - |
| WTI-WCS Differential (US$/Barrel) | 11.2 | 13.0 | 14.1 | 14.3 | - |
| Natural Gas (C$/GJ) | 1.7 | 3.0 | 3.1 | 3.2 | - |
| Canadian Dollar (US Cents) | 72.0 | 73.0 | 74.2 | 75.4 | - |
Balancing Spending Pressures with Restraint
Total expenses are slated to rise by 5.6% in FY 2026/27, then ease to a more moderate average rate of around 3% thereafter. Adjusting for debt servicing costs, program spending is expected to grow by a more subdued 1.8% pace over the three-year planning horizon.
Program spending continues to be driven by core public services. $32.1 billion is earmarked for health care (+6% annual growth) reflecting past rapid population gains, higher utilization, and compensation settlements. Education spending is also planned to jump by 8% to accommodate enrolment growth and address classroom pressures. Social supports are expected to rise more moderately.
Meanwhile, the province’s capital spending program will expand by $1 billion to $9.7 billion in FY 2026-27. Key capital investments are focused on health care, schools, municipal projects, and transportation. Compared with last year’s plan, the three-year capital envelope is higher by $2.2 billion, now totaling around $28.3 billion. Increased capital spending has added materially to borrowing needs, with the government’s borrowing requirements expected to climb by 25% this year (to $20.9 billion). Over 75% of these borrowing needs are expected to be met via long-term debt.
Net Debt to GDP on the Rise
With persistent deficits and elevated capital outlays, the province’s net debt-to-GDP ratio is set to increase to 10.5% for the upcoming fiscal year before reaching 13% by FY 2028/29. Outside of the pandemic, these levels would mark their highest in 30 years. Despite this trajectory, Alberta is expected to retain a healthy advantage over other provinces in terms of relative debt load.
Bottom Line
As was widely expected, Alberta’s 2026 budget shows a significant deterioration in the province’s fiscal fortunes on lower energy prices and spending pressure tied to past soaring population growth. Targeted revenue-raising measures will go some way toward closing the fiscal gap, but some of the heavy lifting has been left for another day. On the plus side, Alberta continues to boast a sizeable balance sheet advantage against its provincial counterparts.
Alberta Government Fiscal Position
[ Millions of C$ Unless Otherwise Noted ]
| Budget 2026 | ||||
| Fiscal Year | 2025-26 Forecast | 2026-27 Estimate | 2027-28 Target | 2028-29 Target |
| Revenue | 75,292 | 74,550 | 78,914 | 81,518 |
| % Change | (8.7) | (1.0) | 5.9 | 3.3 |
| Resource Revenue | 16,286 | 13,213 | 16,234 | 16,891 |
| % Change | (25.9) | (18.9) | 22.9 | 4.0 |
| All Other Revenue | 59,006 | 61,337 | 62,680 | 64,627 |
| % Change | (2.4) | 4.0 | 2.2 | 3.1 |
| Expense | 79,426 | 83,922 | 86,495 | 88,422 |
| % Change | 7.1 | 5.7 | 3.1 | 2.2 |
| Operating Expense | 67,016 | 70,398 | 72,360 | 74,053 |
| % Change | 8.0 | 5.0 | 2.8 | 2.3 |
| Contingency / Disaster Assistance | 1,506 | 2,000 | 2,000 | 2,000 |
| Surplus (+) / Deficit (-) | (4,134) | (9,373) | (7,581) | (6,904) |
| % of Nominal GDP | (0.9) | (1.9) | (1.5) | (1.3) |
| Net Financial Debt | (39,699) | (51,363) | (61,422) | (69,750) |
| % of Nominal GDP | (8.3) | (10.5) | (11.8) | (12.9) |
Disclaimer
This report is provided by TD Economics. It is for informational and educational purposes only as of the date of writing, and may not be appropriate for other purposes. The views and opinions expressed may change at any time based on market or other conditions and may not come to pass. This material is not intended to be relied upon as investment advice or recommendations, does not constitute a solicitation to buy or sell securities and should not be considered specific legal, investment or tax advice. The report does not provide material information about the business and affairs of TD Bank Group and the members of TD Economics are not spokespersons for TD Bank Group with respect to its business and affairs. The information contained in this report has been drawn from sources believed to be reliable, but is not guaranteed to be accurate or complete. This report contains economic analysis and views, including about future economic and financial markets performance. These are based on certain assumptions and other factors, and are subject to inherent risks and uncertainties. The actual outcome may be materially different. The Toronto-Dominion Bank and its affiliates and related entities that comprise the TD Bank Group are not liable for any errors or omissions in the information, analysis or views contained in this report, or for any loss or damage suffered.
Download
Share this: