International Women's Day 
Female Breadwinners Get a Stale Deal 

Francis Fong, Managing Director & Senior Economist 
Likeleli Seitlheko, Economist
Mekdes Gebreselassie, Research Analyst
Daniella Garcia, Corporate Communications and Design Specialist

Date Published: March 4, 2024

Download

Print Version

Share this:


Each year, TD Economics takes this day to recognize the work done and progress still to be made in closing gender gaps and supporting women in our collective journey towards gender equality. This year, we celebrate progress made by highlighting the increasing share of women that are the major income earners in their families, while recognizing the growing challenge that these families face when deciding to have children.

Image of a woman sitting on a stack of money bills looking at a long piece of paper held in her hands. A vase with yellow flowers represents the mimosa flower, the traditional International Women's Day flower, across her.
Image shows a row of three icons of a woman with each icon accompanied by a year/average of years and the respective share of female breadwinners. The first shows the share for 1996 at 23%, the second for 2007 at 27%, and the third shows the average share for 2019 to 2021 at 29%.
Chart shows the average income, in 2019 dollars, broken down into market income and government transfers, and the female breadwinner's share of family income in percent. Market income is $49,800 for 1996, $59,300 for 2007 and $68,700 for 2019 to 2021. Government transfers are $4,000 for 1996, $4,400 for 2007 and $6,600 for 2019 to 2021. The share of family income is 64% for 1996, 63% for 2007 and 62% for 2019 to 2021.
Image of a green circle highlights the share of female breadwinners that contribute 70% or more to their family's income in 2019 which is 27%.
Image of a piggy bank with a dollar sign on it.
Image shows half of a male's icon and half of a female's icon with a scale behind swung downwards on the male's side and higher on the female's side. This represents the gender pay gap with an average family income of $128,200 for those with male breadwinners and $116,600 for those with female breadwinners, in 2019.
Image shows a female standing on a pile of coins and a male standing on a higher pile of coins representing the gender wealth gap with average financial assets of $60,700 for families with female breadwinners and $92,100 for those with male breadwinners, in 2019

Chart above shows bar graphs comparing the average employment earnings of a female breadwinner to the government transfers she could receive while on maternity leave in Ontario and Quebec in 2021. For Ontario, earnings is $72,000 compared to $29,700 in maternity and parental benefits (EI) plus $2,700 in federal and provincial child benefits. For Quebec, earnings is $70,800 compared to $50,200 in maternity and parental benefits (QPIP) plus $4,200 in federal and provincial child benefits.
Image shows an icon of a female with 36% of it colored green, representing the share of breadwinners amongst females without children and an icon of a female holding a child with 27% colored green, representing the share of breadwinners amongst females with children.
Image shows a row of five gauges: the first shows the share of breadwinners amongst 25–29-year-old females without children at 39%, the next four show the shares of breadwinners amongst females 30-34, 35-39, 40-44, and 45-49 years of age with children gradually increasing at 24%, 28%, 29%, and 34%, respectively.
Image of a baby toy with stringed flower, butterfly, and bird figures.
The bottom of the infographic is bordered by mimosa flowers.

Notes

  1. Income data draws from non-elderly couple economic families with 25–44-year-old females and/or all major income earners in the same age group, unless stated otherwise.
  2. Child benefits for the couple's child(ren) have been evenly split between the couple.
  3. Financial assets include registered retirement income funds, RRSP investments including locked in RRSP's, non-registered: bonds, money in banks, mutual funds, other investment/financial assets, income trusts, stocks and shares, and TFSAs for couple and lone-parent economic families where the major income earner is 25-44 years of age.
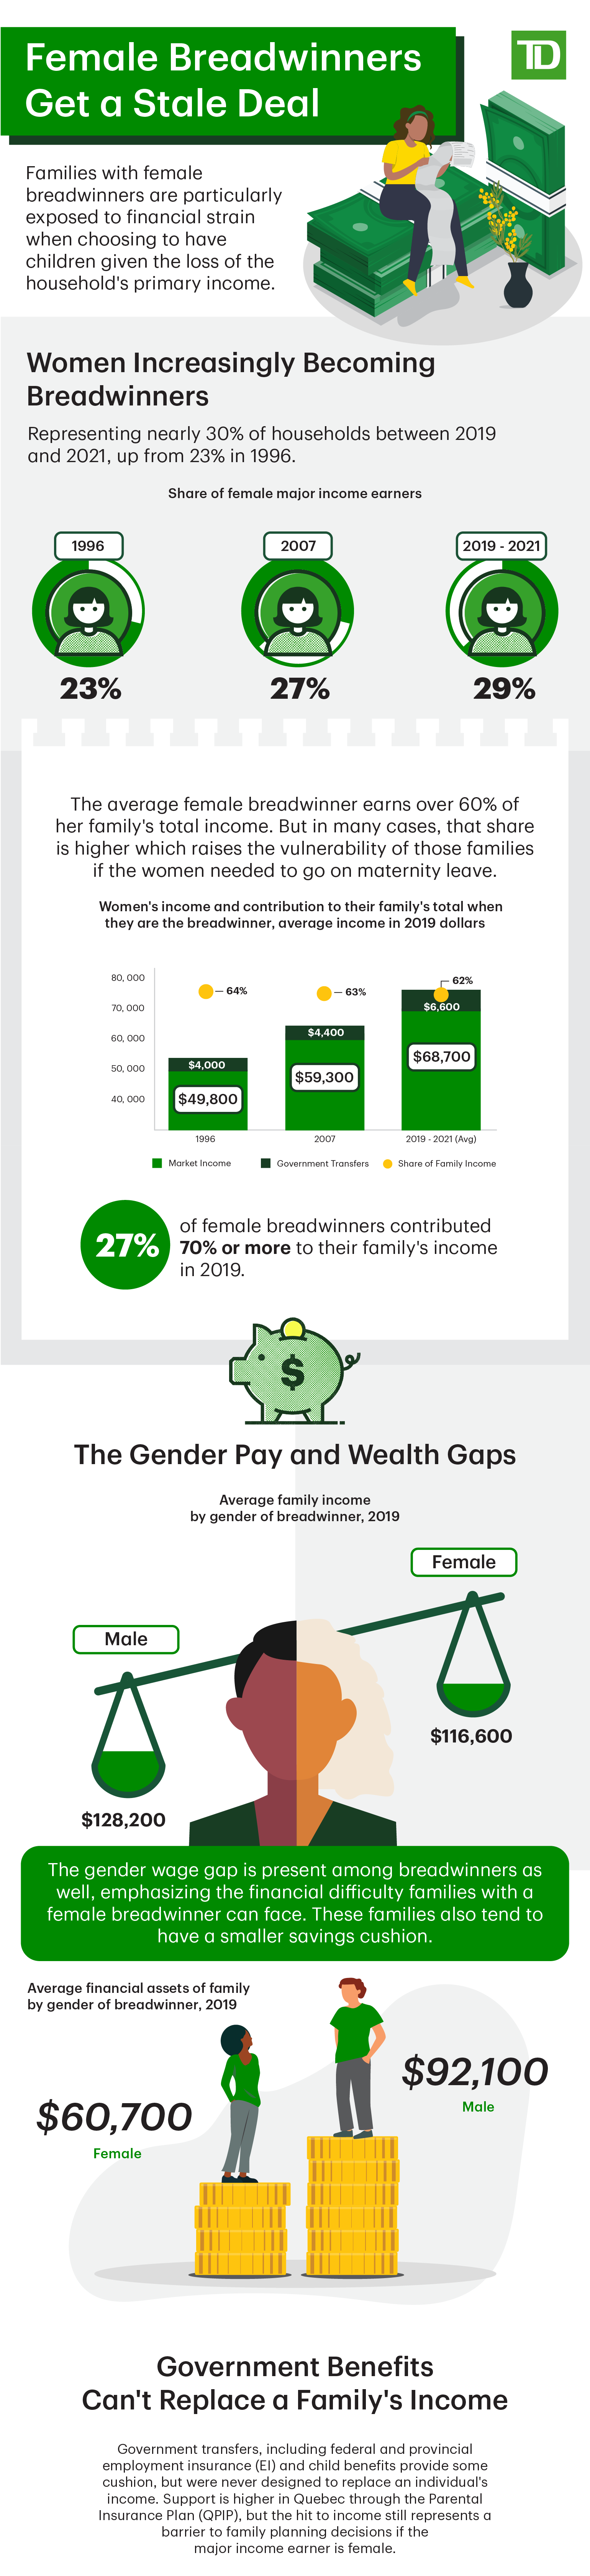
  4. For the chart showing maternity/parental/child benefits, the employment earnings is calculated for an average female breadwinner without children and government transfers estimate what she would get over a one-year maternity plus parental leave for her first child.

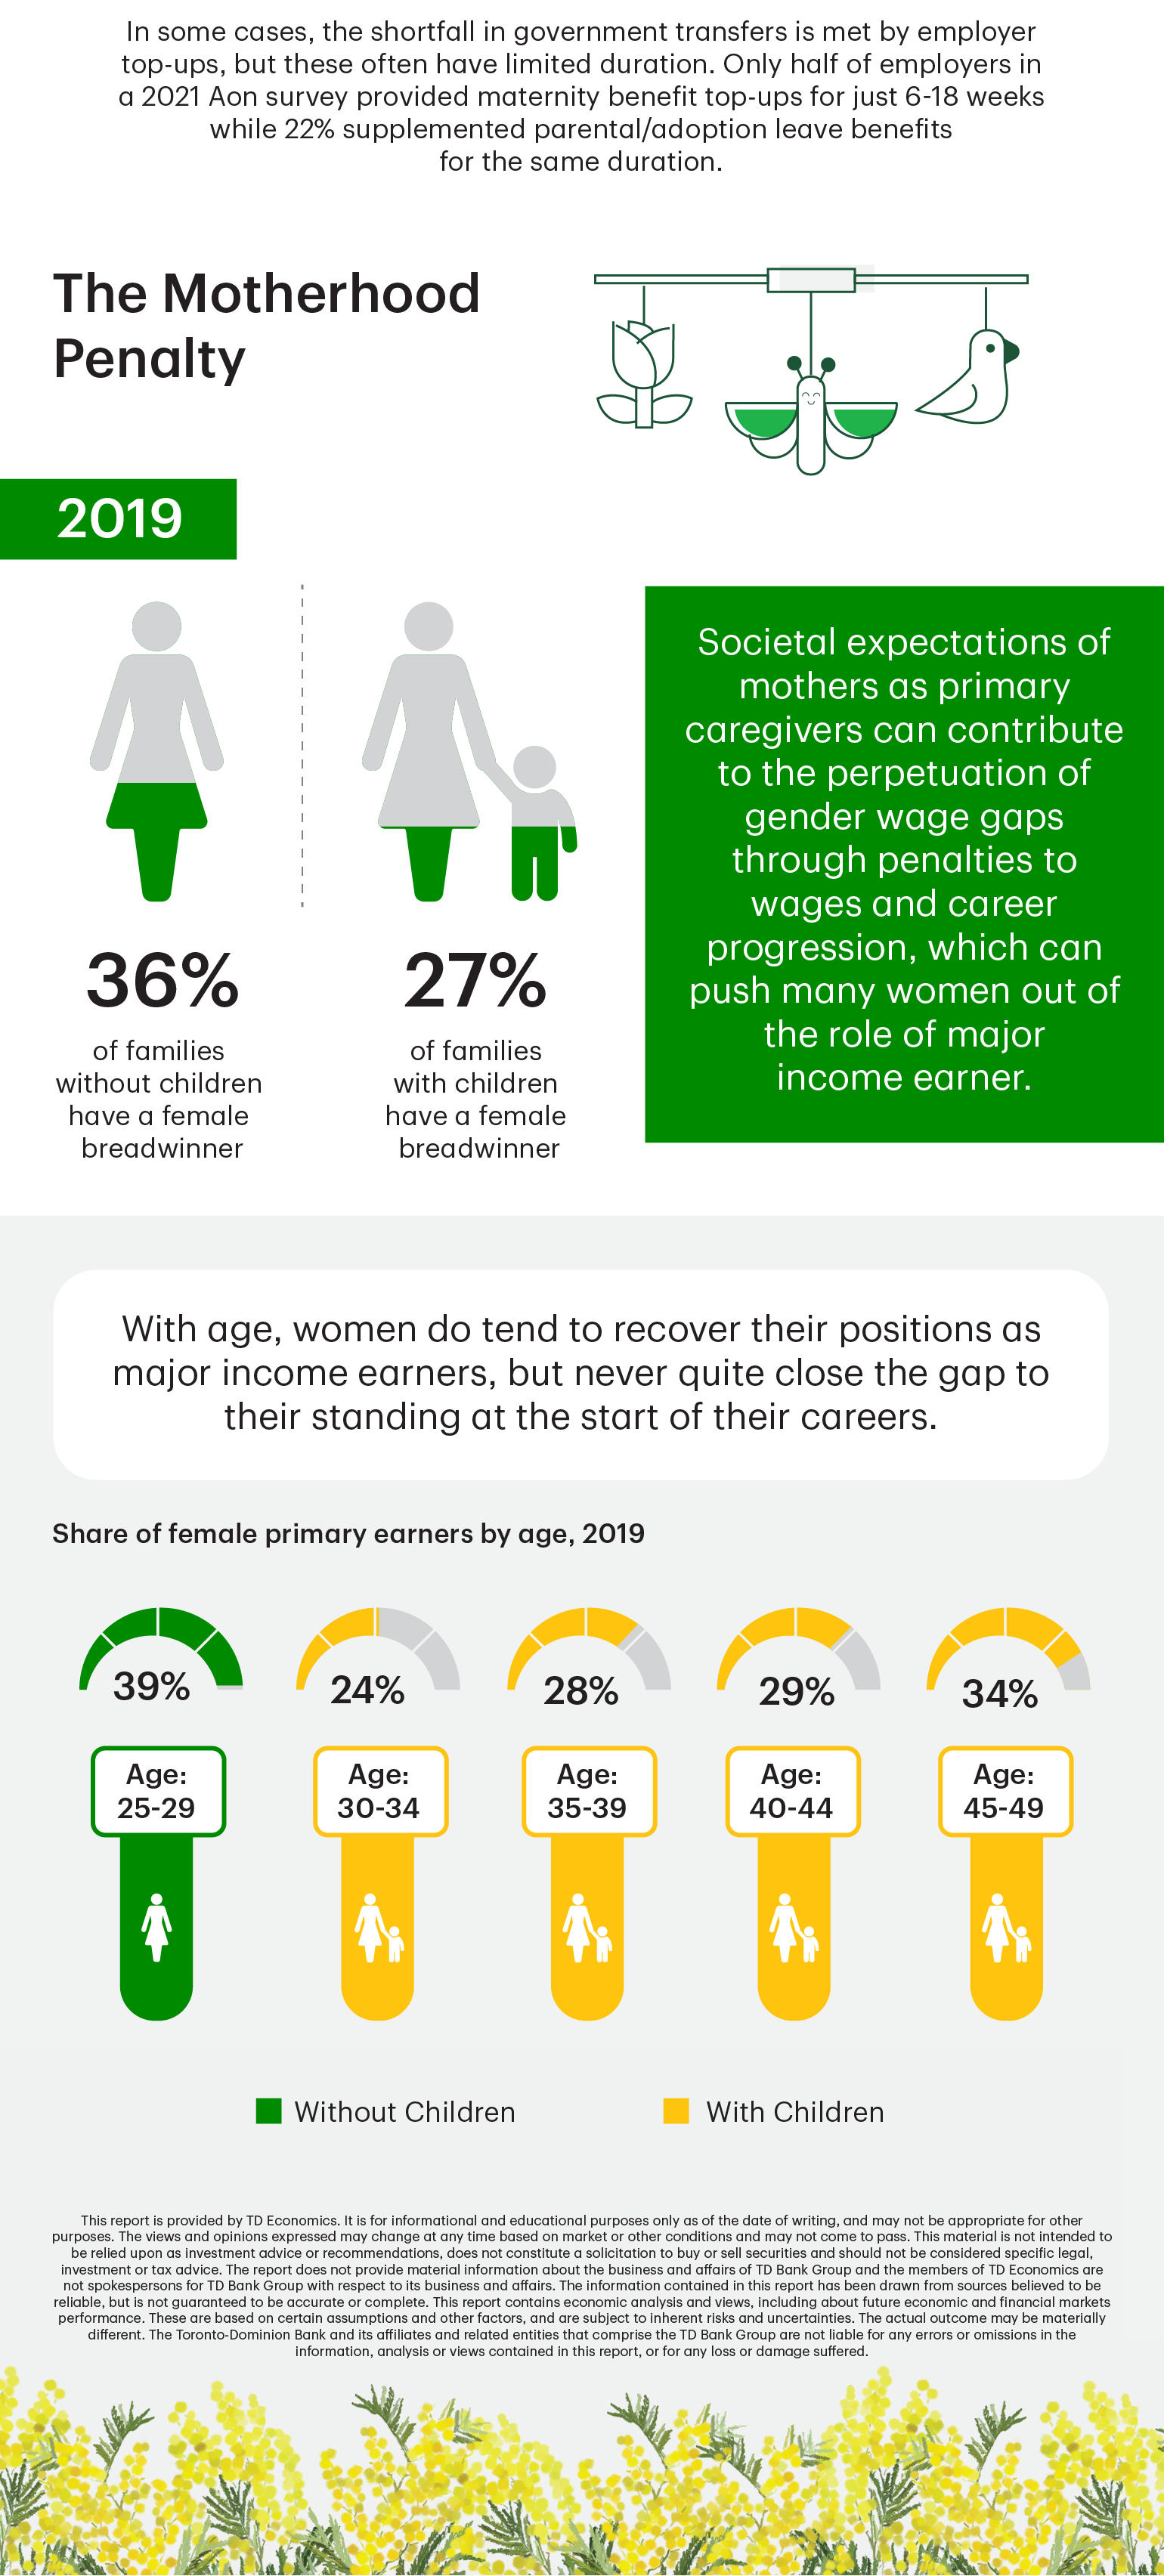
Sources: Aon Rapid Response Survey - Supporting Families at Work: Maternity and Parental Top-up Trends (2021), Canada Revenue Agency, Government of Quebec, Statistics Canada - Canadian Income Survey: Public Use Microdata File (2019, 2020, 2021), Survey of Financial Security: Public Use Microdata File (2019), Survey of Labour and Income Dynamics (1996, 2007).

Disclaimer