More Canadians Will Have Immigrant Backgrounds in the Future
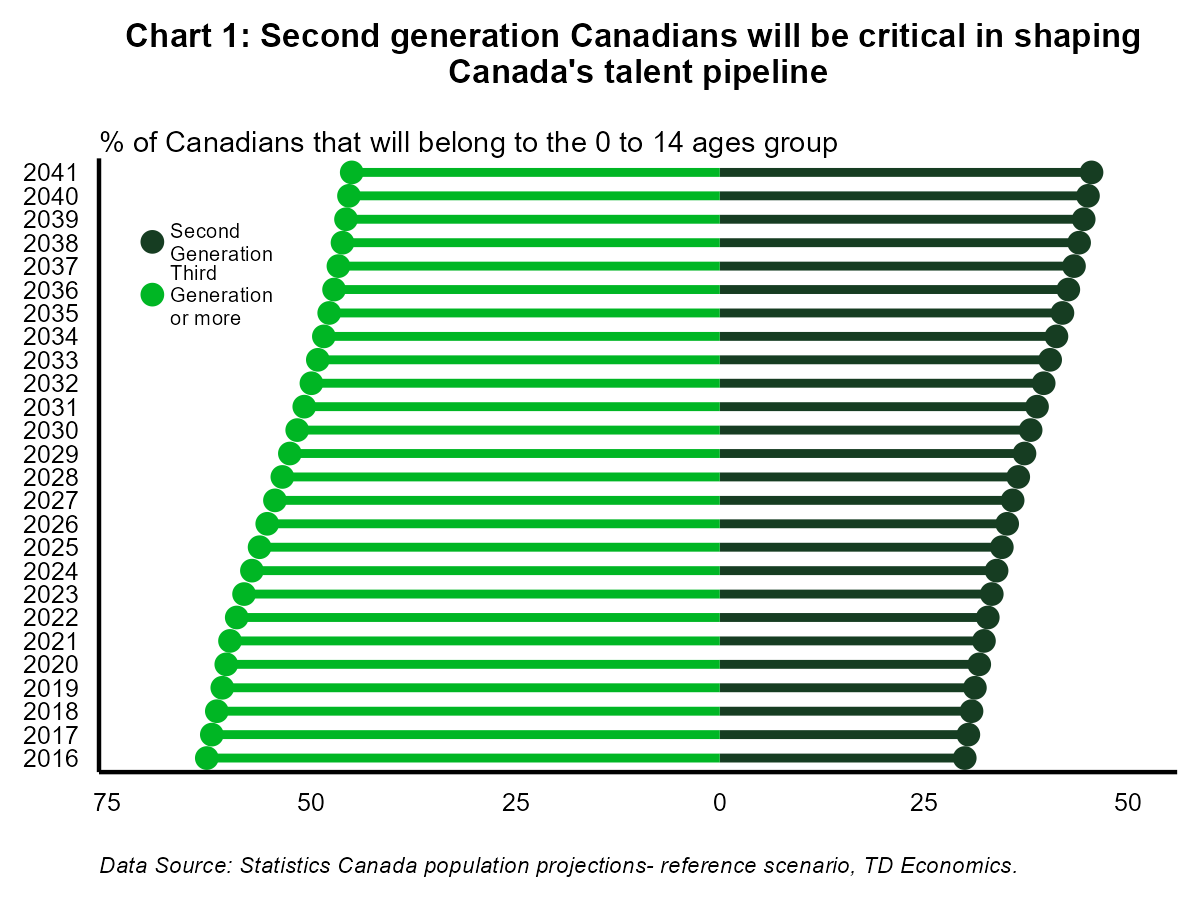
Canada is winning the race for talent on a global stage. Almost one in four Canadian residents were born in another country.1 Immigration is a key source of Canada's population growth and helps to rejuvenate the labour force even as the population ages. Looking beyond the immediate value that immigrants bring to the country, their children (second-generation Canadians) offer an equally significant contribution with a growing influence.2 Within the next 13 years, almost half of all Canadian children will be second-generation (Chart 1).3
With an unemployment rate near a historical low, the Canadian labor market is rife with opportunity, especially for highly-skilled workers. Second-generation Canadians are well placed to reap the rewards thanks to their educational training and skillset. Putting the spotlight on the economic outcomes of children born to newcomers provides a glimpse at Canada's future.
Second-Generation Canadians Are More Likely to Graduate University
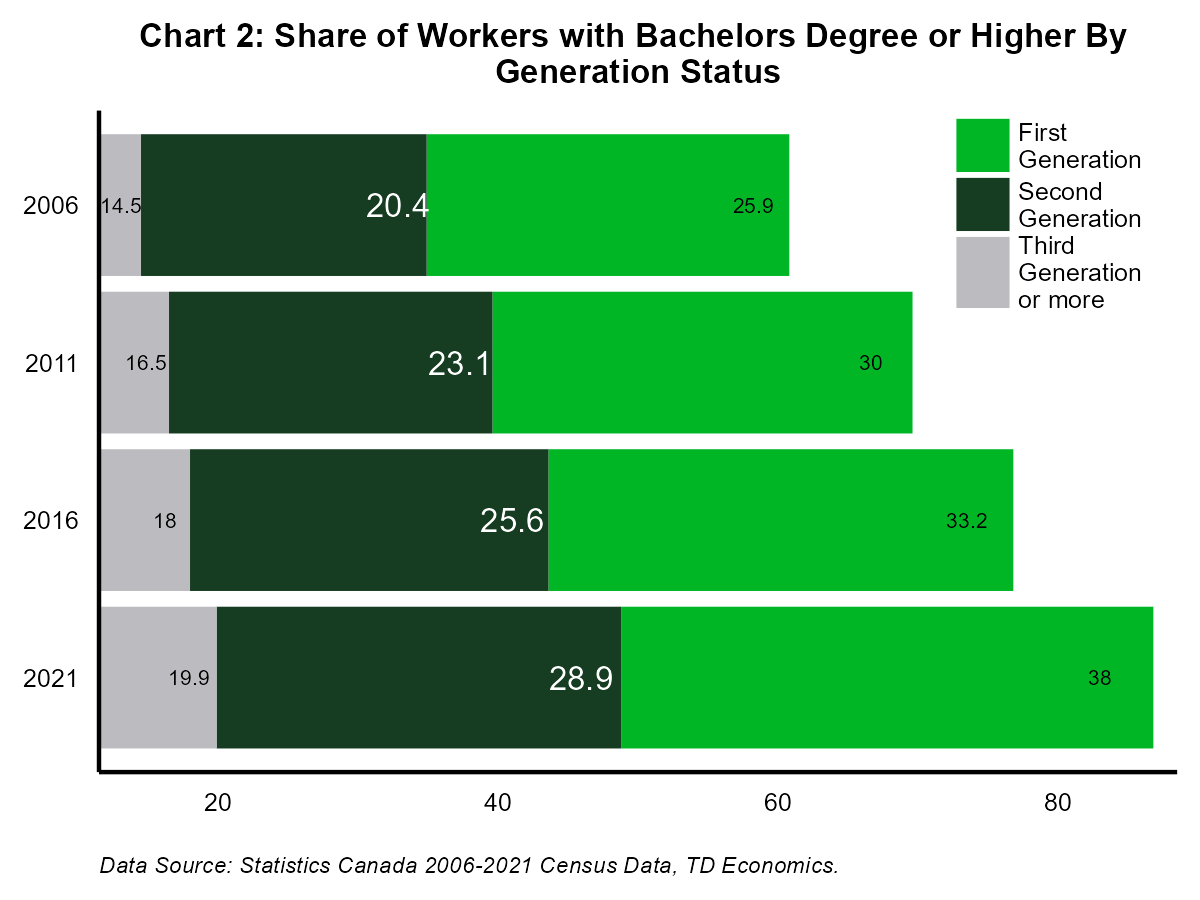
Canadians born to immigrant parents share unique perspectives that knit together local customs with cultures and traditions from abroad. Parents influence their children's future in numerous ways, including the value they place on education. Similar to their parents, second-generation Canadians are more likely to hold university degrees and pursue higher education in STEM (Science Technology Engineering and Math) programs than Canadians raised by non-immigrants. The share of second-generation Canadians that graduated from college climbed faster than third- (or more) generation Canadians, from 20% in 2006 to 29% in 2021 (Chart 2).4 These academic gains help to bolster Canada's talent pipeline.
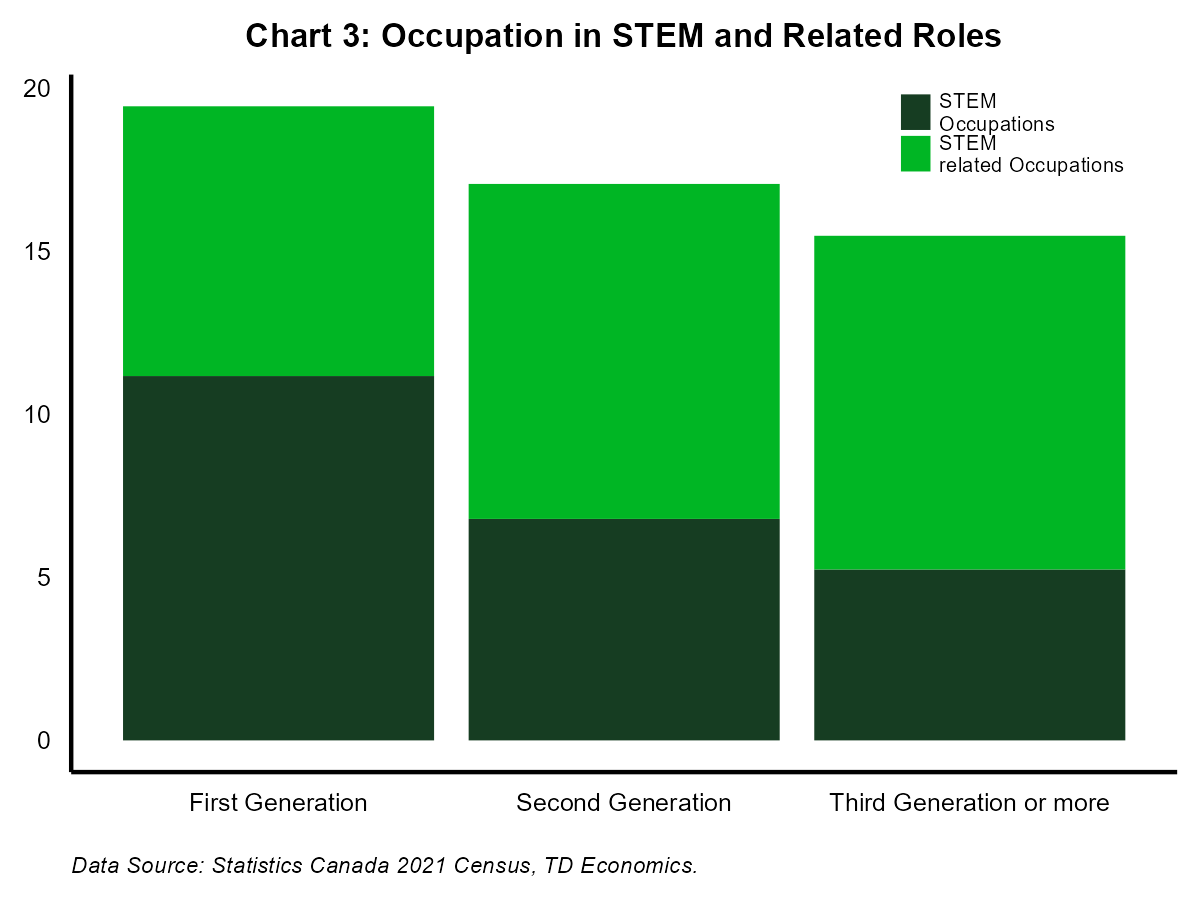
The latest 2021 Census data shows that 17% of prime age workers are engaged in STEM and related occupations (Chart 3). Second-generation Canadians are also more inclined to apply their education and work in highly skilled occupations than workers whose parents were born in Canada. Their skillsets give them a competitive edge in a job market facing a shortage of skilled workers.
And Work in Jobs that Require Post-Secondary Education
Second-generation Canadians have greater success than newcomers in garnering value from their higher education in the job market. According to the 2021 Census data shows that half of university-educated second-generation workers are engaged in jobs requiring degrees, compared to 36% of first-generation Canadians. That experience is comparable to the outcomes of children of non-immigrants. Second-generation Canadians have shown greater success in ascending to management roles than the first generation.
Second-Generation Canadians Share their Parents Generations' Entrepreneurial Spirit
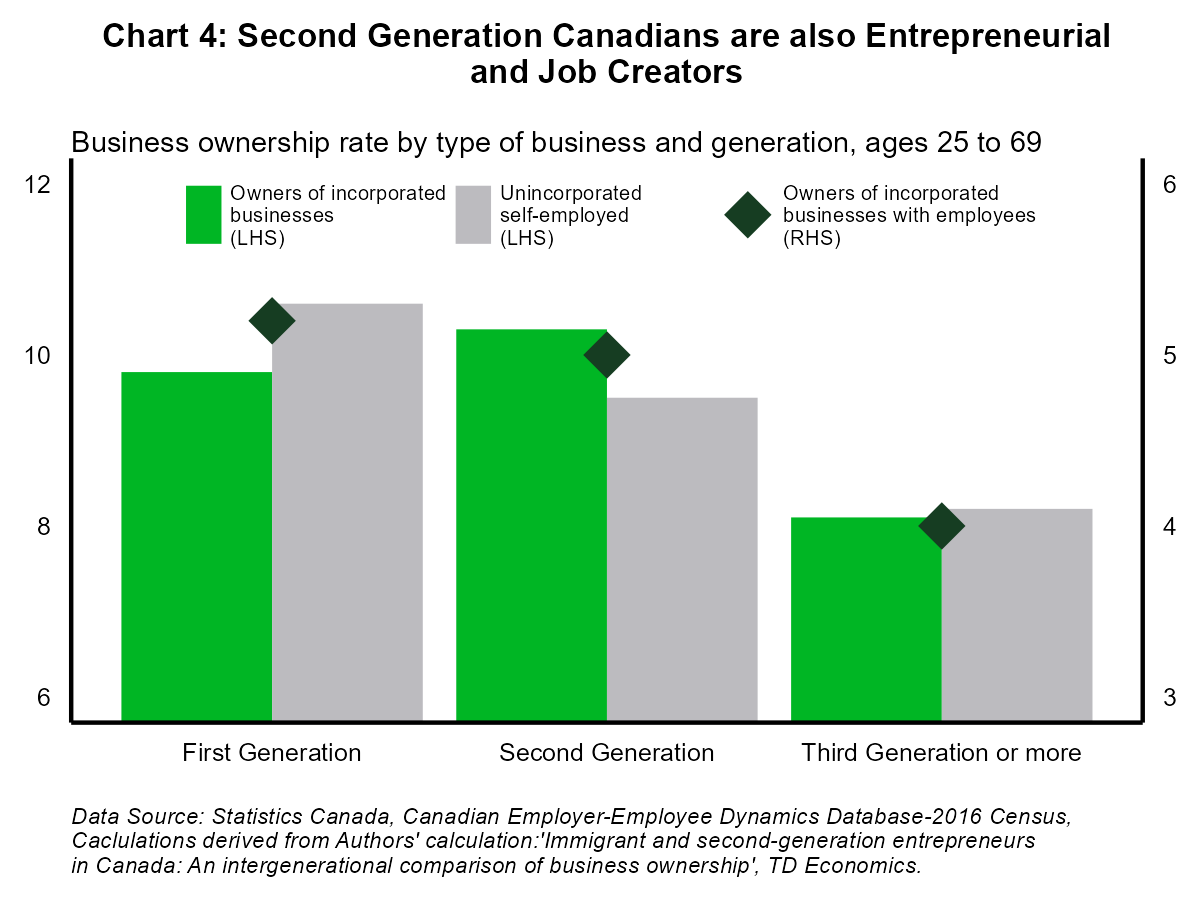
Like first-generation Canadians, entrepreneurship comes naturally to second-generation Canadians (Chart 4). Many of the businesses run by second-generation Canadians are based in skilled industries such as professional/scientific and technical (18.2%), construction (15.1%) and healthcare and social assistance (13.6%).5 These businesses create jobs that are an essential fabric of many Canadian cities. Small to medium sized enterprise accounts for 88% of the private labour force in Canada.6
Second-generation Canadians are also more inclined to lean on their STEM educations and build businesses in sectors that have high-to-medium research and development intensity. That's a positive for Canada in its ambition to boost innovation and secure its place on a global scale. Having a greater cultural proximity to foreign markets may help these businesses expand globally and broaden exports with the rest of the world.
Second-Generation Canadians May Face Barriers in Career Progression
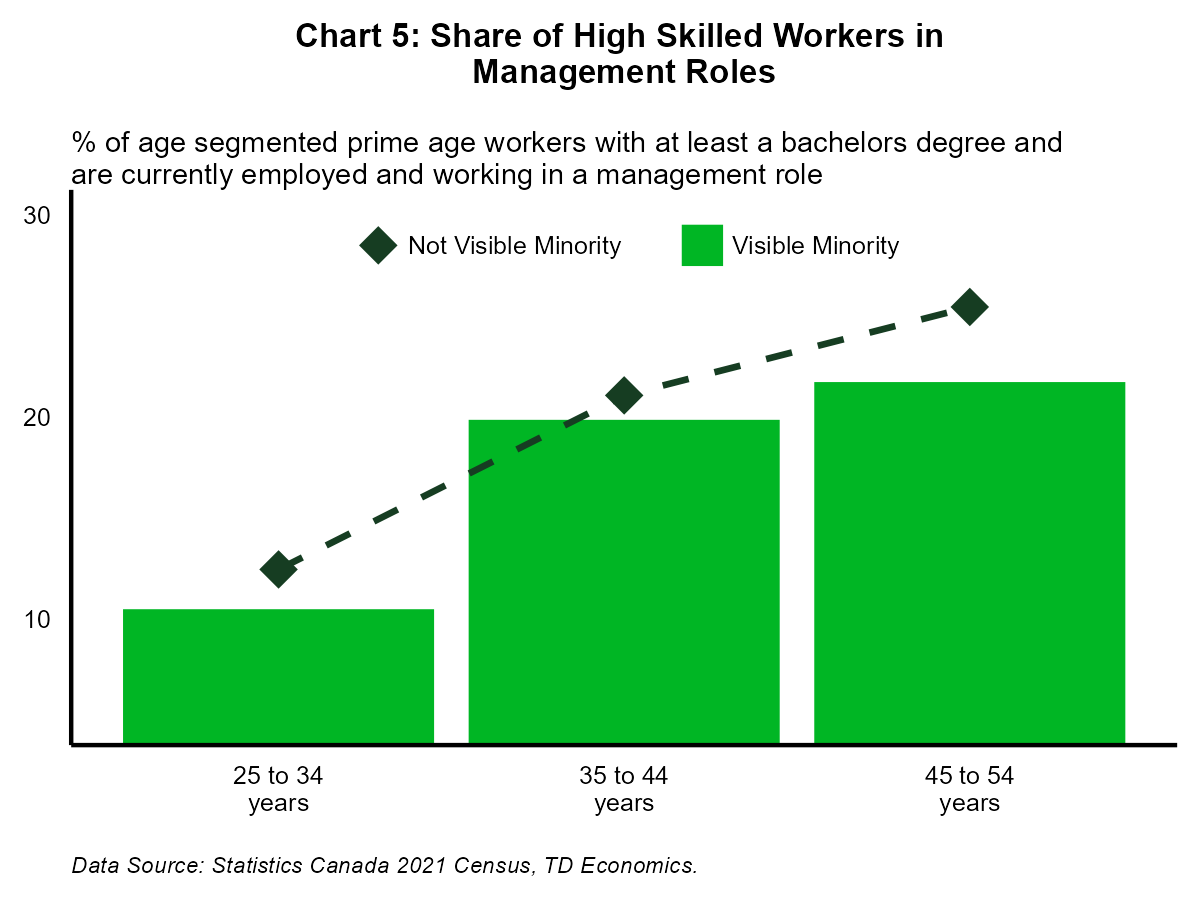
Looking at the situation from 10,000 feet, there's much to celebrate. However, beneath the surface there are pockets of weakness as some groups struggle to reach their highest potential. Though many second-generation workers achieve success in entering management roles, some cohorts are less represented in management above the age of 45. Highly skilled second-generation Canadians who identify as visible minority groups tend to be underrepresented in management roles as they progress in their career (Chart 5). This may imply hiccups in career progression and may show a weakened ability to foster social capital within professional spheres.7
Wage Gaps Exist Between Some Groups of Second and Third Generation Canadians
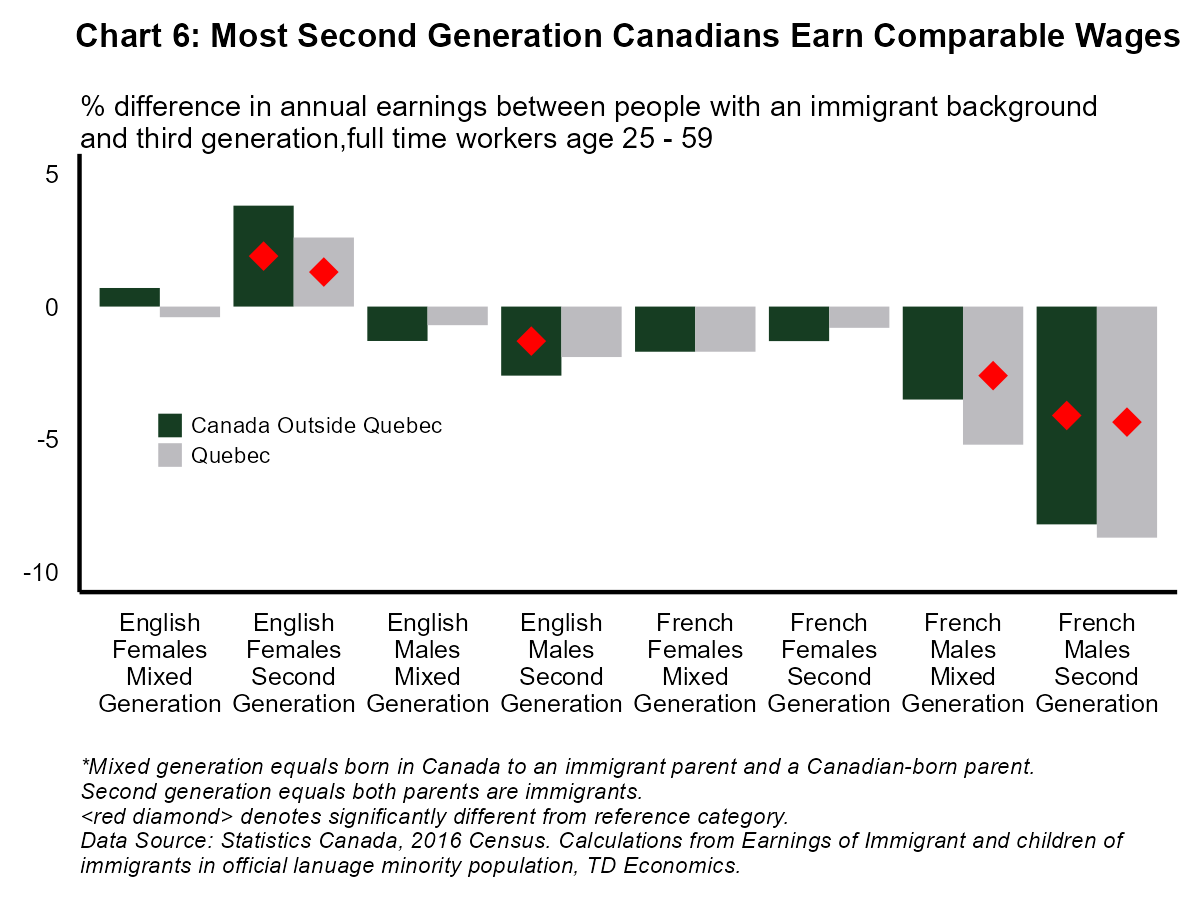
Second-generation Canadians generally earn comparable wages to third-generation Canadians. However, pockets of underperformance exist among certain demographic groups.8 According to a deep dive analysis of 2016 Census micro data by researchers at Statistics Canada, the largest wage gap is among French-speaking men, with second-generation Canadians earning 8.2% to 8.7% less than third- (or more) generation Canadians (Chart 6).9 In contrast, English-speaking second-generation women earn 2.6% to 3.8% more than the Canadian children of non-immigrants.10 The upcoming release of the 2021 census micro data will show the extent to which things improved on a granular level.
Text Box 1: Immigrants Have the Right Skill Mix but Lag in Opportunities
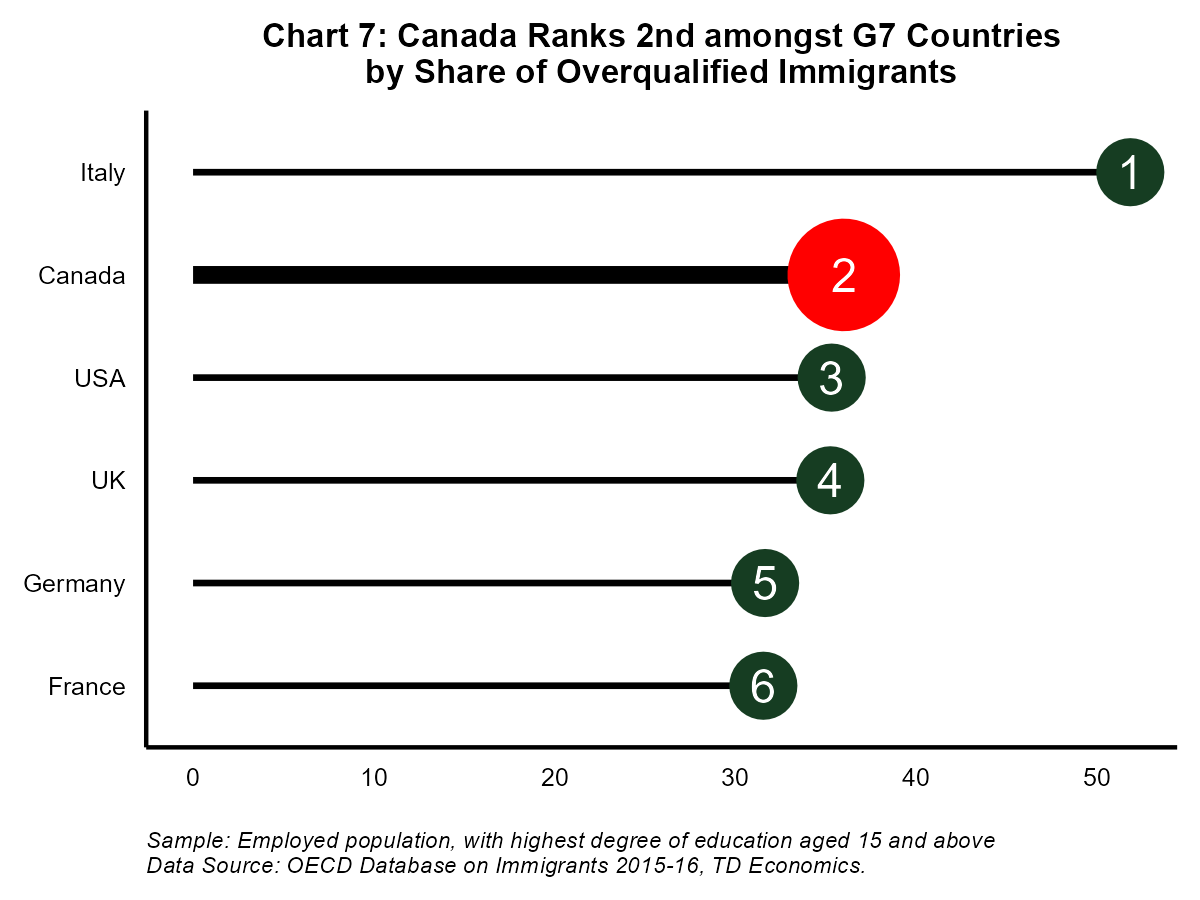
Canada takes the top spot amongst G7 countries in terms of its immigrant share. Canadian immigrants also top the charts in educational attainment (Bachelor's and above) and skill level (referring to managers, professionals, technicians, and associate professionals). While Canada brings in a large number of highly-educated and highly-skilled immigrants, it does a poor job of maximizing their potential. First-generation Canadians are more likely to work in low wage jobs than second- and third-generation Canadians (17.7%, 12.4% and 11.2% respectively). Unfortunately, this puts Canada near the top of a much less commendable list; it ranks second among G7 countries in terms of the share of immigrants that feel overqualified for their jobs (Chart 7).
Ensuring the Success of Second-Generation Canadians
Canada's skills pipeline is ripe with talent originating from an increasingly diverse pool. The contribution of second-generation Canadians is one of the many benefits immigrations brings to the Canadian economy. While there's much to celebrate, there are still gaps that prevent some second-generation workers from reaching their full potential. As we progress as a nation, it is important to put measures in place so that we ensure no one gets left behind.
Canada's tight labour market offers workers opportunities to move into better roles. We expect second-generation workers to be among the first to benefit from this environment. The yet-to-be-released micro data from the 2021 Census will paint a more current and granular picture of how things have evolved in recent years. We will re-evaluate this analysis when that data becomes available.
End Notes
- According to the 2021 Census, almost one in four people (23.0%) counted during the 2021 Census are landed immigrant or permanent resident in Canada.
- 'Second generation includes persons who were born in Canada and had at least one parent born outside Canada. For the most part, these are the children of immigrants.
- Children with an immigrant background: Bridging cultures https://www12.statcan.gc.ca/census-recensement/2016/as-sa/98-200-x/2016015/98-200-x2016015-eng.cfm
- 'Third generation or more' includes persons who were born in Canada with all parents born in Canada.
- Immigrant and second-generation entrepreneurs in Canada: An intergenerational comparison of business ownership by Garnett Picot and Yuri Ostrovsky, 202. https://www150.statcan.gc.ca/n1/en/pub/36-28-0001/2021009/article/00003-eng.pdf?st=-WtRNfR7
- As of 2021, small businesses employed 8.2 million individuals in Canada, or 67.7% of the total private labour force. By comparison, medium-sized businesses employed 2.5 million individuals (20.4% of the private labour force) and large businesses employed 1.4 million individuals (11.8% of the private labour force). These Charts exclude self employed individuals. https://ised-isde.canada.ca/site/sme-research-statistics/en/key-small-business-statistics/key-small-business-statistics-2022#s1
- Social capital reflects the resources gained from existing with a social network. It’s a concept that’s centered on our ability to use social connections to solve problems, improve well-being, pursue shared goals, and take collective action. Higher levels of social capital mean you can achieve more, as an individual, team or company. Lower levels, or fewer social connections, will make it much harder to achieve the same goals." Source: betterup.com
- Results from the 2016 Census: Earnings of immigrants and children of immigrants in official language minority populations by Rene´ Houle https://www150.statcan.gc.ca/n1/pub/75-006-x/2019001/article/00007-eng.htm
- Women generally earn 89cents per dollar earned by males. https://www150.statcan.gc.ca/n1/pub/14-28-0001/2020001/article/00003-eng.htm
- The latest available public use Census Micro data is the 2016 Census Data.
- Women generally earn 89cents per dollar earned by males. https://www150.statcan.gc.ca/n1/pub/14-28-0001/2020001/article/00003-eng.htm
Disclaimer
This report is provided by TD Economics. It is for informational and educational purposes only as of the date of writing, and may not be appropriate for other purposes. The views and opinions expressed may change at any time based on market or other conditions and may not come to pass. This material is not intended to be relied upon as investment advice or recommendations, does not constitute a solicitation to buy or sell securities and should not be considered specific legal, investment or tax advice. The report does not provide material information about the business and affairs of TD Bank Group and the members of TD Economics are not spokespersons for TD Bank Group with respect to its business and affairs. The information contained in this report has been drawn from sources believed to be reliable, but is not guaranteed to be accurate or complete. This report contains economic analysis and views, including about future economic and financial markets performance. These are based on certain assumptions and other factors, and are subject to inherent risks and uncertainties. The actual outcome may be materially different. The Toronto-Dominion Bank and its affiliates and related entities that comprise the TD Bank Group are not liable for any errors or omissions in the information, analysis or views contained in this report, or for any loss or damage suffered.
Download
Print Version
Share this: