Highlights
- While Canada and the U.S. have made moderate progress in cutting greenhouse gas emissions, reaching their respective 2030 emissions reduction targets will be a challenge given the speed at which required new investment can be implemented.
- Emissions trends in the main emitting sectors highlight important lessons. In the electricity sector, supporting the expansion of non-emitting baseload generation including nuclear power is essential to complement ongoing efforts to boost renewable power generation.
- The two countries may have to prioritize different measures for addressing emissions in the oil and gas sector as carbon dioxide is the main greenhouse gas emitted in the sector in Canada while methane dominates in the U.S.
- Stronger support for the adoption of electric vehicles is necessary in Canada to counteract the impact of higher population growth, which led to more driving activity offsetting the benefits from the falling emissions intensity of internal combustion engine vehicles.


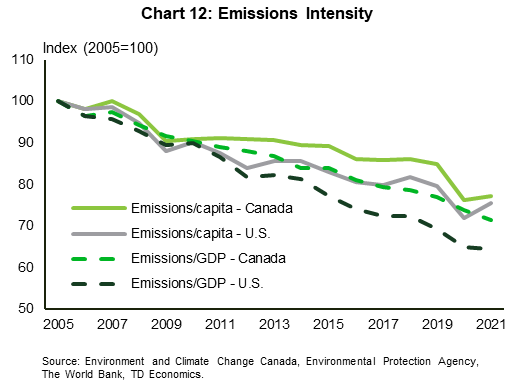
Both Canada and the U.S. have set ambitious targets to reduce greenhouse gas (GHG) emissions by 40-45% and 50-52%, respectively, by 2030 relative to their 2005 levels. But as of 2021, emissions had fallen by only 8.5% in Canada and 15.2% in the U.S.1 This leaves a lot of runway to cover in the remaining six years, raising the question on whether it can be done. In addition, it is important to understand why Canada's performance has lagged that of the U.S. and if there are lessons on where emissions reductions can come from. Not only have absolute emissions declined more in the U.S., but so has the emissions intensity on a per capita and per unit of GDP basis.
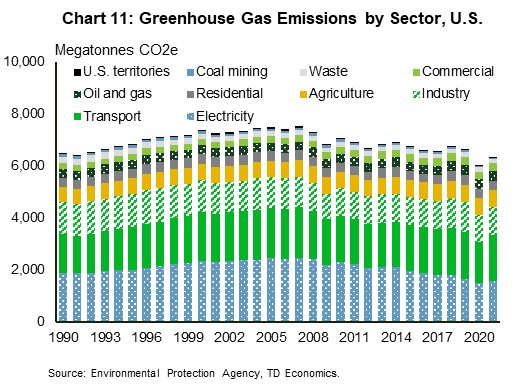
Among the main emitting economic sectors,2 Canada has been more effective at reducing emissions in the electricity sector. However, this sector accounted for a larger share of total emissions in the US and thus contributed more to the decline in overall emissions there. Moreover, the U.S. has made stronger inroads in the transportation sector, further tilting the figures in their favor (Chart 1). Contrary to conventional thinking, emissions from the oil and gas sector increased at a roughly comparable rate between 2005 and 2021 though the sector was more impactful in offsetting emissions reductions seen elsewhere in Canada (Chart 2). Making further progress on decreasing the gap between the current emissions pathway versus one aligned with the Paris Agreement will require strengthening efforts in the main emitting sectors that can significantly move the needle on national numbers.
Policies and market dynamics drive emissions trends
The trajectory of emissions across various sectors is driven by a combination of factors that include regulations, government-industry partnerships and changing market dynamics. The role of regulations is particularly evident in the transportation sector where stricter emissions/fuel economy standards have led to a decline in the emissions intensity of road transportation. However, this failed to translate to lower absolute emissions in Canada during the pre-pandemic years in part due to higher population growth that led to higher driving activity, thereby offsetting the impact of falling emissions intensity. In contrast, the U.S. benefited from a lower rise in road transport activity.
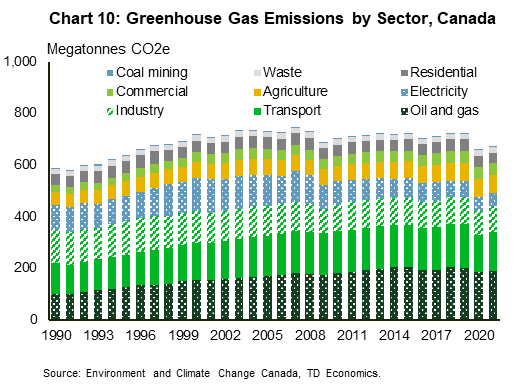
Additionally, differences in the importance of sectors within total emissions contributed to better U.S. outcomes. This factor also informs on which sectors are critical for advancing progress on interim emissions reduction targets. Around half of each country's total emissions in 2021 came from the two leading emitting sectors, which were oil and gas and transportation for Canada and transportation and electricity for the U.S.
Coal regulations advantaged Canada on electricity emissions reduction
Regulatory changes have carried significant impacts on electricity sector emissions, which have been falling since peaking in 2001 in Canada and in 2007 in the U.S. In Canada, the earlier decline in emissions was thanks to an Ontario government-mandated closure of coal plants, whereas Alberta is to credit with the more recent decline in Canada’s emissions. The changes in Alberta have been driven by provincial and federal regulations aimed at eliminating emissions from coal power generation by 2030. The commitment by the Alberta government to compensate the impacted utilities for retiring their coal power plants early also likely improved support for the plan from the utilities.3 As well, the rising carbon price seems to have played a role in incentivizing a faster transition away from coal. For example, TransAlta cited potential lower margins due to increasing carbon costs, projected to reach $405 million if they took no action, as one of the reasons behind its move to get off coal faster in Canada.4 In the U.S., a handful of states (e.g., Oregon, New York, Washington) have implemented legislation mandating emissions reduction from coal power plants. For example, New York phased out coal power generation in 2020 through regulatory measures.
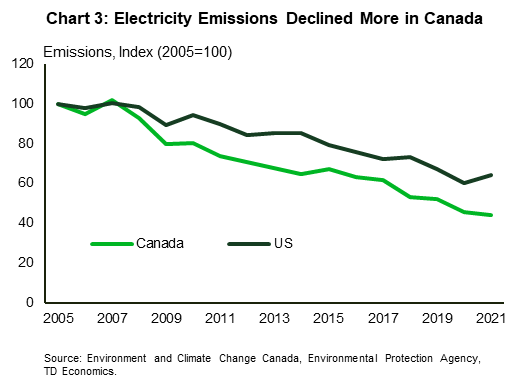
The regulations have been effective at reducing electricity generation from coal power plants. Between 2005 and 2021, coal (+coke) power generation decreased by 66% in Canada and 55% in the U.S.5,6 Over the same period, natural gas power generation rose by 86% in Canada and more than doubled in the U.S. The steeper decline in coal-fired generation and relatively smaller increase in unabated natural gas-fired generation allowed emissions in the electricity sector to fall more in Canada over this period (Chart 3). But, because the sector accounts for a larger share of total emissions in the U.S., it has contributed more to the reduction in U.S. national emissions (Chart 2). Bear in mind that in both countries, the electricity sector was the main contributor to the decline in overall emissions. Had emissions from electricity generation remained unchanged between 2005 and 2021, total emissions would have increased by 0.5% in Canada (versus an 8.5% decline) and decreased by 3.5% in the U.S. (versus a 15.2% decline).
In addition to regulations, the improving economic competitiveness of natural gas and renewables also helped displace coal generation. In the U.S., natural gas and wind replaced coal as the largest source of in-state electricity generation in 14 states between 2001 and 2021.7 These include states like Mississippi, Alabama and Georgia that do not have a renewables portfolio standard or clean electricity standard and thus the change in the electricity supply mix was largely market driven rather than policy-driven. Similarly, Alberta was on track to shut down its last coal plants by early 20248 – six years ahead of the deadline – aided in part by lower natural gas prices and decreasing costs of renewable energy technologies.
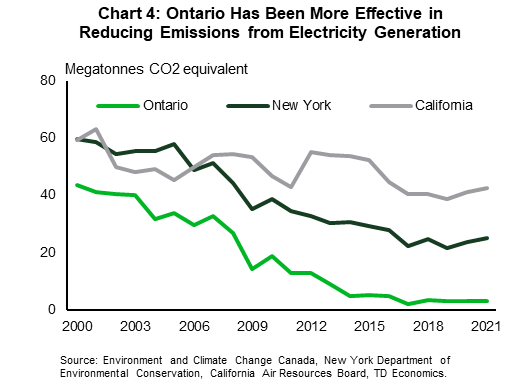
However, the next phase of reducing emissions from gas generation could be tougher ground to win compared to tackling emissions from coal generation. Among other things, there is a need for sufficient low-carbon baseload generation capacity (e.g., hydro and nuclear) to complement renewables and storage. This is one area where Ontario's plan for phasing out coal was effective from an emissions perspective and could serve as an example for others. In addition to renewables and natural gas, the province also invested in bringing additional nuclear capacity online.9 While Ontario still depends on unabated gas-fired generation as a source of flexible power, it has been more successful at reducing power sector emissions compared to California and New York, both of which retired part of their nuclear capacity in recent years (Chart 4). California is an interesting case because solar and wind generation has increased substantially and accounted for about a quarter of domestic generation in 2021, up from just 2% in 2005.10 Nevertheless, emissions from the sector declined by just 6% between 2005 and 2021.11 The state would have made better strides in decreasing emissions from electricity generation had it invested in bolstering nuclear capacity. Instead, the nuclear generation lost between the 2011 peak and 2021 was equivalent to around 20% of its unabated fossil fuel generation in 2021.
Falling emissions intensity of road transport eroded in Canada by more driving activity
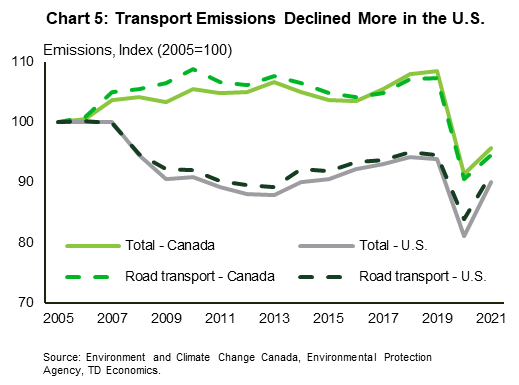
The transportation sector is the largest emitting economic sector in the U.S. and the second largest in Canada. Emissions from transportation declined more in the U.S. than in Canada between 2005 and 2021, which also led to a greater reduction in total emissions in the U.S. (Charts 1 and 2). However, Canada did close the gap in 2020/2021, though this was partly an artefact of the pandemic. In contrast, the U.S. demonstrated earlier success in reducing emissions post 2005, with a notable step-down occurring and being largely sustained following the 2007-09 recession (Chart 5). Road transportation accounts for most of the emissions from the sector, with light duty vehicles (LDV) accounting for over half of transportation emissions in Canada and around 60% in the U.S.
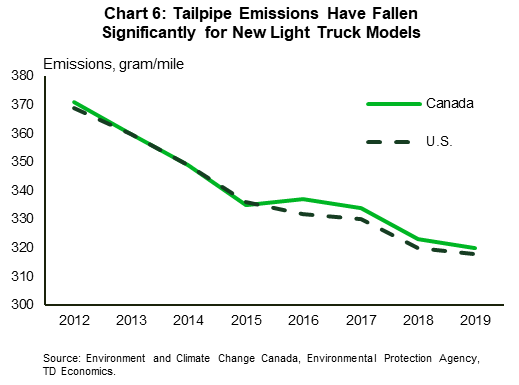
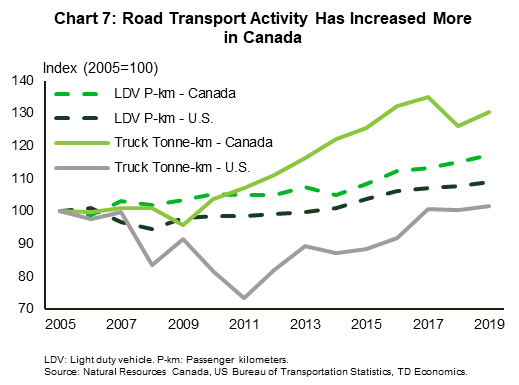
Regulations have been effective in reducing the emissions intensity of road transportation, although higher activity levels and a faster transition towards trucks eroded the benefits of emissions intensity improvements in Canada. Both countries have adopted increasingly stringent and harmonized emissions/fuel economy standards and have also tackled the carbon intensity of the gasoline and diesel itself through biofuel blending requirements. As a result of these changes, tailpipe emissions of vehicles have been in long-term decline (Chart 6). However, tonne-kilometers and passenger-kilometers increased more in Canada between 2005 and 2019, which can partly be explained by higher population growth (Chart 7). This stronger increase in activity levels explains why Canada has been less successful than the U.S. in reducing transport emissions. In addition, from 2005 to 2019, the stock of light-duty trucks, which emit more greenhouse gases than passenger cars, rose much faster in Canada, driving the higher increase in the stock of light-duty vehicles. While electric vehicle (EV) sales have been rising rapidly in recent years, EVs still comprise a small share of the total vehicle fleet in both countries. In 2021, they represented about 1% of cars and less than 1% of trucks.12 As such, the impact of EVs on emissions as of 2021 was still minor though it is expected to improve with more widespread adoption in the coming years.
Overall, the pre-pandemic trend informs us that Canada may face additional headwinds for tackling emissions in the transportation sector than the U.S. due to its faster growing population, which has resulted in higher road transport activity levels offsetting declines in emissions intensity. Therefore, it may be imperative for Canada to promote and support the production and adoption of electric vehicles more aggressively to counteract the impact of higher population growth on transport emissions. As well, expanding public transit reach and making it more convenient and reliable for commuters (e.g., more frequent service and sheltered stops that provide protection from the cold winters) could incentivize more people to use buses and trains instead of driving. The U.S. is also compelled to improve efforts to reduce transport emissions as it is unlikely to reach its interim targets without its largest emitting sector playing a meaningful role.
The oil and gas sector shows progress in reducing methane emissions
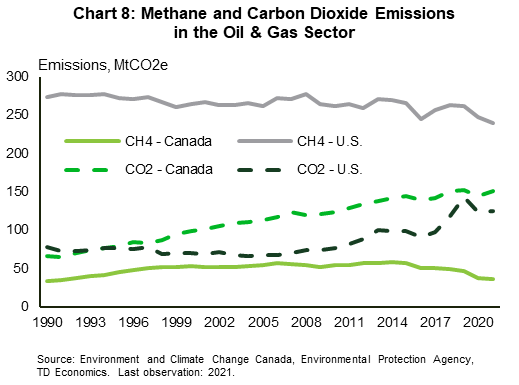
The oil and gas sector is another important source of emissions especially in Canada where it is the main emitting sector. Emissions from the sector have increased since 2005 due to higher natural gas production in the U.S. and rising oil production in both countries, as well as the shift towards more emissions intensive oil production in Canada. Methane and carbon dioxide comprise nearly all the emissions from oil and gas, with nitrous oxide contributing a negligible share. In Canada, carbon dioxide makes up the majority of emissions in the sector in contrast to the U.S. where methane dominates, which implies the two countries may have to prioritize different measures for tackling emissions in the sector (Chart 8). The increase in total sectoral emissions was comparable between 2005 and 2021; however, the sector had a bigger impact on offsetting emissions declines from other sectors in Canada. To get a sense of its relative importance, if emissions from oil and gas had not changed between 2005 and 2021, total national emissions would have declined by 11.3% (versus 8.5%) in Canada and 15.7% (versus 15.2%) in the U.S.
Measures that have contributed to declining methane emissions include regulations, voluntary approaches and government-industry partnerships. In the U.S., methane emissions have been in long-term decline since the early 1990s. This is in part due to voluntary programs that encourage oil and gas companies to reduce methane emissions such as the Natural Gas STAR program started by the U.S. Environmental Protection Agency in 1993.13 A handful of states such as California and Pennsylvania have also adopted regulations to address methane emissions.
Similarly, in Canada, provincial governments in Alberta, British Columbia and Saskatchewan, as well as the federal government, have set methane emissions reduction targets along with accompanying regulations. Governments have also played a role in supporting companies to adopt technologies that reduce methane emissions.14 Additionally, Canada has also benefited from relatively flat production in recent years of natural gas and conventional oil, which together account for over 80% of methane emissions from the oil and gas sector.
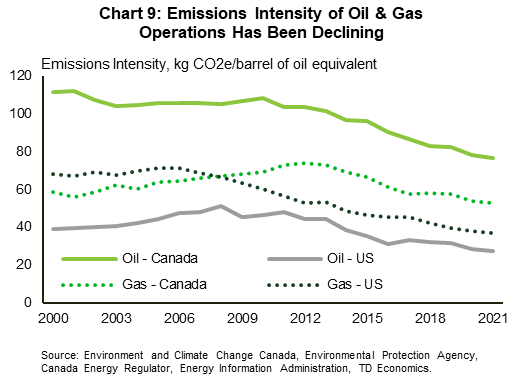
Another aspect where the sector has improved is in lowering emissions intensity, as measured by sectoral emissions per unit of oil and gas produced (Chart 9). This metric has been decreasing for several years as production growth has outpaced the growth in emissions. Nonetheless, these efforts do eventually have to translate into a reduction in absolute emissions for the industry to get on a net-zero pathway. This is especially the case in Canada where a decline in absolute emissions from oil and gas will likely be necessary for the country to reach its 2030 emissions reduction target given the sector's relative importance to total emissions. Accordingly, it is imperative to get the proposed carbon capture and storage projects built and operational as quickly as possible to meaningfully lower carbon dioxide emissions and add to the progress being made with methane emissions reductions. The U.S., on the other hand, needs to be much more aggressive in strengthening ongoing efforts to fight methane emissions.
Bottom Line
Although both the U.S. and Canada have made modest strides in reducing emissions, reaching the 2030 emissions reduction targets will be a tall order at the current rate of progress, the speed at which the needed new investment can be implemented and the given short period that remains. But there are lessons that each country and sub-national jurisdiction can learn from comparatively successful decarbonization efforts in other places. In the electricity sector, regulatory measures and falling relative prices of renewables and natural gas has enabled jurisdictions to reduce and even eliminate emissions from coal power generation. However, as the experiences of Ontario and California indicate, focusing on boosting renewable power generation alone is not a sufficient measure for cutting electricity emissions and more effort is required on building low-carbon baseload generation including nuclear power.
There are also structural issues that the two countries must contend with. For instance, the oil and gas sector is a bigger contributor of emissions in Canada than in the U.S., which places more emphasis on its importance to reaching the interim targets aligned with the Paris Agreement commitment. Moreover, as carbon dioxide is the main greenhouse gas emitted in the sector within Canada, while methane is the main one in the U.S., the two countries may need to prioritize different measures. Similarly, the U.S. is unlikely to reach its interim targets without improved efforts to reduce emissions in the transportation sector, which is its largest emitting economic sector. But Canada also faces challenges in the transportation sector due to its higher population growth, which contributed to steadily rising transport emissions pre-pandemic despite the significant improvements in the emissions intensity of internal combustion engine vehicles. Therefore, the government must be more aggressive with facilitating the transition towards EVs and building more charging infrastructure. As the recent mid-January cold snap highlighted, EVs have significantly reduced driving range on frigid days, which can make owning one challenging in a cold country like Canada if there is insufficient fast charging infrastructure. Current long wait times for some EV models in Canada also indicate that supply could potentially be a limiting factor if left unaddressed.
Appendix
End Notes
- Canada's 2023 National Inventory Report uses global warming potential (GWP) values from the IPCC's Fourth Assessment Report (AR4) to convert non-CO2 GHG emissions to their CO2-equivalent values while the U.S. data is based on GWP values from the IPCC's Fifth Assessment Report (AR5). Updating Canada's emissions numbers to reflect the GWP values from the AR5 did not meaningfully change the conclusions reached in the paper, which are based on the official data. However, the AR4 versus AR5 comparison for Canada was incomplete as it was not possible to update emission values for the various hydrofluorocarbons and perfluorocarbons because their data is reported aggregated. Canada's official estimates based on the AR5 GWP values will be available starting with the 2024 inventory report.
- The definition of many economic sectors varies between the U.S. and Canada data. For this paper, the categories were adjusted to try to make the data as comparable as possible.
- Michelle Bellefontaine, CBC News, Coal-fired power plants to get $1.1B in compensation over next 14 years, November 24, 2016
- TransAlta, A Leader in Clean Electricity: 2019 Annual Integrated Report, March 3, 2020
- Canada Energy Regulator, Canada's Energy Future 2023: Data Appendices
- U.S. Energy Information Administration, Electricity Data Browser
- U.S. Energy Information Administration, Coal was the largest source of electricity generation for 15 states in 2021, December 7, 2022
- Government of Alberta, Phasing out emissions from coal
- Government of Ontario, The End of Coal, December 15, 2017
- California Energy Commission, Total System Electric Generation
- California Air Resources Board, California Greenhouse Gas Inventory for 2000-2021 — by Sector and Activity, December 13, 2023
- International Energy Agency, Global EV Data Explorer, April 26, 2023
- Clayton Munnings and Alan Krupnick, Comparing Policies to Reduce Methane Emissions in the Natural Gas Sector, Resources for the Future Report, July 2017
- Government of Alberta, Reducing methane emissions
Disclaimer
This report is provided by TD Economics. It is for informational and educational purposes only as of the date of writing, and may not be appropriate for other purposes. The views and opinions expressed may change at any time based on market or other conditions and may not come to pass. This material is not intended to be relied upon as investment advice or recommendations, does not constitute a solicitation to buy or sell securities and should not be considered specific legal, investment or tax advice. The report does not provide material information about the business and affairs of TD Bank Group and the members of TD Economics are not spokespersons for TD Bank Group with respect to its business and affairs. The information contained in this report has been drawn from sources believed to be reliable, but is not guaranteed to be accurate or complete. This report contains economic analysis and views, including about future economic and financial markets performance. These are based on certain assumptions and other factors, and are subject to inherent risks and uncertainties. The actual outcome may be materially different. The Toronto-Dominion Bank and its affiliates and related entities that comprise the TD Bank Group are not liable for any errors or omissions in the information, analysis or views contained in this report, or for any loss or damage suffered.
Download
Print Version
Share this: