
To watch the 20 minute presentation, see here.
The media and analysts often point to the resilience of the global economy, with the U.S. as a stand-out on that narrative.
Pushing the boundaries a bit, let’s explore whether the U.S. has tripped over the boundary of economic resilience and moved into exceptionalism.
This requires some permanent defiance of economic laws and carries a different implication for the policy path. It would see a deceleration of inflation absent economic pain.
Last month, Federal Reserve Chair Powell said strong economic growth is not a problem, as long as inflation continues to unwind. This challenges even the notion of a ‘soft’ landing. Are we in a world of a no-landing glide path? If so, how sustainable could it be?
And then there’s the Bank of Canada, caught in the opposite world of a deteriorating economy and a slow deceleration in inflation, perhaps bringing to mind more of a classic stagflation scenario. The January CPI data delivered a welcomed downside surprise, but one month does not make a trend. And it’s not going to be enough to prompt the Bank of Canada to leap into lowering the policy rate to resuscitate the broader economy.
My main concern is how long will the Bank of Canada stay boxed in by high shelter costs that prevent the right-fitting of monetary policy to the performance of the rest of the economy?
American Economic Exceptionalism Is Unrelenting
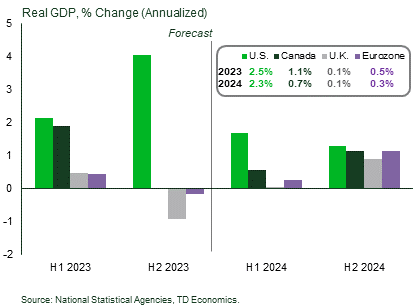
Let’s start with a graph to capture the growth divergence of the U.S. to other countries. That divergence was expected to narrow in the first half of 2024. It does look to be doing so but not to the degree forecasters expected, including us.
U.S. GDP growth of 2.3% in 2024 will nearly match last year’s pace. This assumes a step down in growth as the year progresses, which these days has become a forecast risk given the exceptionalism that continues to be displayed.
As for Canada, the economy underperformed our expectation last year, but the deviation was well within the margin of error and did not alter our 2024 outlook. The same is true for other regions in Europe.
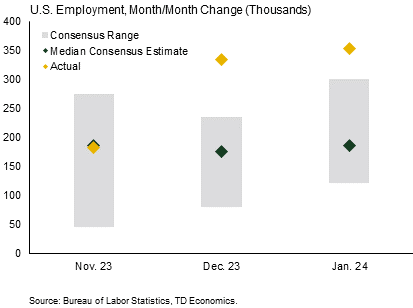
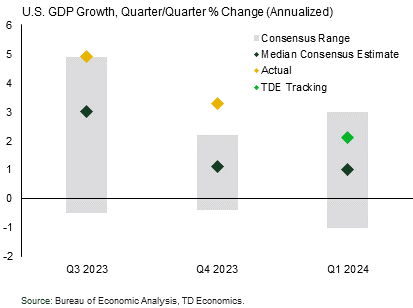
U.S. Forecast Misses Hit Embarrassing Levels
I’m not mincing words by referring to the forecast misses as “embarrassing”.
Other countries are conforming to model dynamics as the pandemic distortions recede. This means that traditional interest rate relationships are carrying more predictive power.
This is not the case for the U.S. where the misses on the forecast have become larger, and I’ve characterized them as embarrassingly large given the stage of the economic cycle that should produce more intuitive results.
The gray bars represent the range of analyst views for jobs and GDP. The actual data overshot even the upper end of people’s views.
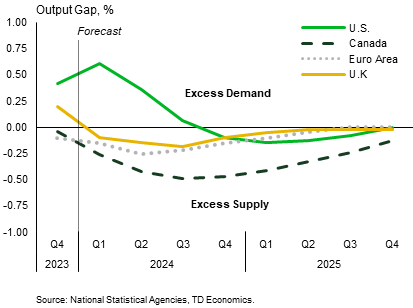
U.S. In Excess Demand, While Others Slip Into Slack
So it makes sense that the U.S. economy is the only one that’s still in excess demand, while other nations have moved into economic slack. And given that U.S. GDP is tracking just north of 2% in the first quarter, it will take time for the economy to be in a position where supply outstrips demand. This generally requires growth rates with 1-handles on them.
We have this within our forecast in the second quarter and beyond, but are naturally nervous that America will keep defying gravity.
And if you’re wondering why Canada shows more economic slack than Europe, that’s because population growth is more than three times greater, and this creates a higher level for potential GDP growth that we have been
undershooting.
Yet, U.S. Inflation Has Eased Alongside Others
Given how much the U.S. is standing apart from peers, it is less intuitive that all regions have experienced similar downward movements in inflation irrespective of the amount of economic slack. This reinforces the belief that the first leg down on inflation was largely related to the unwinding of supply-side factors with the healing of the post-pandemic economy.
The reason people say the second leg down to 2% will be hard-fought ground is because it returns to the view of a synching back up to traditional economic dynamics between supply and demand. In other words, some degree of economic sacrifice.
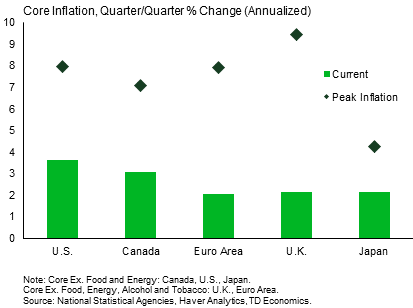
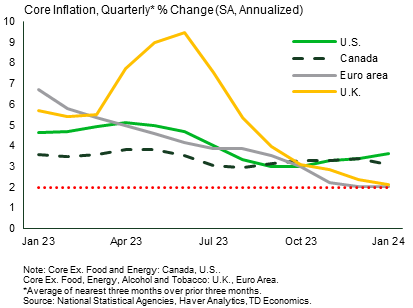
Inflation Cools More Aggressively Abroad
For both the eurozone and the UK, economic slack formed so quickly in the second half of 2023 that the 3-month trend in their core inflation metrics completely collapsed towards the 2% target.
The U.S. was trending favorably and looked to be coming in for a landing, until recently getting lift off again.
And Canada, is the true anomaly. It is in a position of economic slack and yet had one of the least cooperative inflation dynamics, until a little ray of hope emerged in the January data where, for the first time in months, we had a favorable surprise on inflation.
So what’s going on?
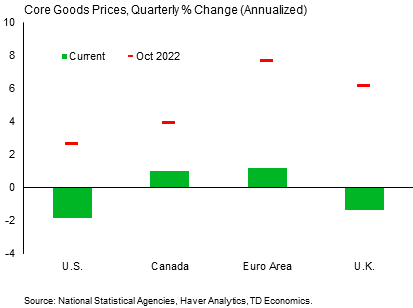
Progress on inflation for the U.S. has come on the back of declining prices for goods products (like furniture and clothing). Prices on the service side haven’t budged and actually accelerated in the January CPI data. This makes sense in the context that the economy remains in excess demand.
The reason prices have collapsed so quickly in the euro area and the UK is because of capitulation in core service prices, where the rolling quarter trend is running at 2.6% compared to 5.6% in the U.S.
What’s particularly interesting is that markets are pricing roughly the same timing and amount of rate cuts no matter the country.
The U.S. rate-cut expectation is sitting at June, as is the ECB, while the BoC and BoE oscillate between June and July. This doesn’t seem consistent given the different backdrops. Perhaps it’s more likely that European banks cut earlier than markets anticipate, or that the U.S. goes later and by less than markets expect.
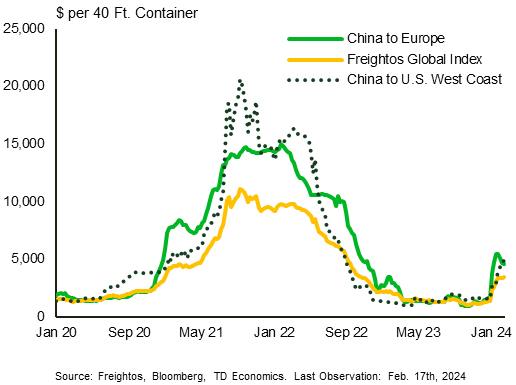
Geopolitical Factors Can Quickly Raise Inflation Risks
And we can’t dismiss geopolitical risks. The escalation of Israel and Hamas tensions to surrounding regions is pressuring shipping costs by rerouting cargo away from the Suez Canal towards the lengthier route around the Cape of Good Hope. That diversion has pushed up container freight rates between China to Europe by roughly four-fold since October, and it has doubled shipping rates from China to the U.S.
Although the uptick in costs is dwarfed compared to the pandemic period, these are still sizeable shifts that, once again, indicate an elongation of supply chains.
Given that U.S. inflation is decelerating on the back of reduced prices for goods products, this development is not good. The disinflationary forces that have benefited advanced countries may start to unwind.
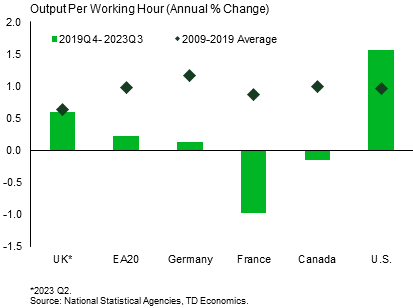
U.S. Has Productivity Working In Its Favor
Which places even more emphasis on what happens within this graph.
Productivity and inflation are two sides of the same coin. If an economy can produce more with the same volume of inputs, then they succeed in exerting downward pressure on prices. This is the only way to square the circle on how a country can sustain strength in jobs and economic growth, and simultaneously have less pressure on prices. And when it comes to productivity, the U.S. is exceptional to its peers. It’s the only country where the average growth of the past four years is still outpacing its historical average.
But to hold the claim of exceptionalism, the outperformance needs to be sustained. Unfortunately, when Powell was asked about this, he expressed skepticism and believes a return to pre-pandemic trends is the more likely path.
So, let’s take a look at that next.
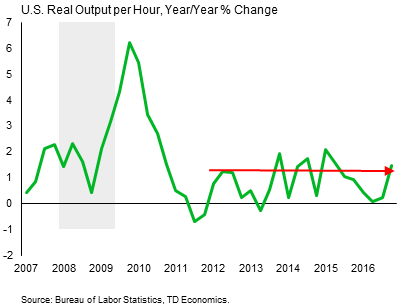
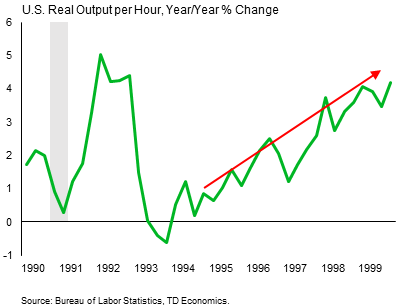
Where to From Here: Tech Boom 90s or Post-GFC Slump?
Powell is referring to this period between 2012 and 2019, where productivity growth averaged just over 1%.
Productivity shifts have key characteristics during recessions. That extreme up and down pattern that occurred following the Global Financial Crisis is a trademark pattern after an economic shock. Firms prioritize capital investments in the early stages of recovery, and then the dynamic switches to labor force normalization about two years out.
We’re focused on what happens to productivity growth three years from the shock and beyond, which is the pocket we’ve now entered. And unfortunately, history isn’t a consistent guide on this front.
- This graph shows the pattern of the 1990s, the era when the world came “online” via the world wide web, high-speed Internet access, personal computing power, and the development of the digital infrastructure.
- However, today’s proponents of AI’s transformative powers would probably argue that the future of America probably looks more like that first graph.
- Unfortunately, we just don’t know for sure which path the economy will follow. Only hindsight will be able to answer this.
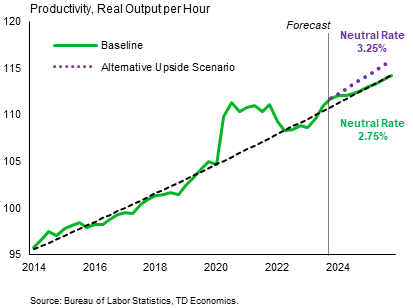
The Productivity Puzzle Matters for Interest Rates
It’s an important area of discovery because that path matters for the trajectory of interest rates.
If we are on a higher, permanent trajectory, than we estimate the neutral fed funds rate would be at least 3.25%, and possibly higher. This implies that the Fed has a shorter path on rate adjustments and can wait longer before embarking on that journey.
But if Powell is correct and the productivity boost will not be sustained in the near-term, by extension, this means the economy must slow substantially to sustain inflation at 2% … and the operative word here is “sustain”.
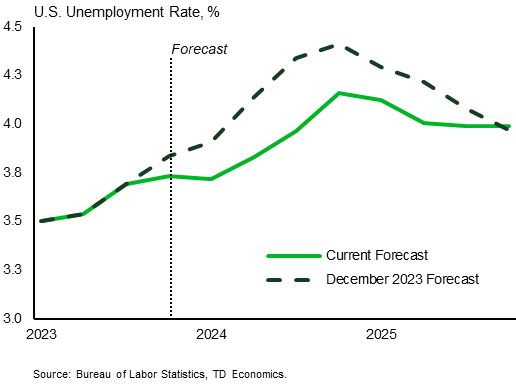
The Area Of Largest Forecast Revision
This seems at odds with this graph showing that one of the biggest areas of adjustment in our forecast is a downward shift in the unemployment rate. We continue to anticipate some slack to build into the labor market as employers temper demand, but we have less confidence it’ll come via meaningful job losses. This means a tight labor force becomes a limiting factor on the extent to which the unemployment rate can rise.
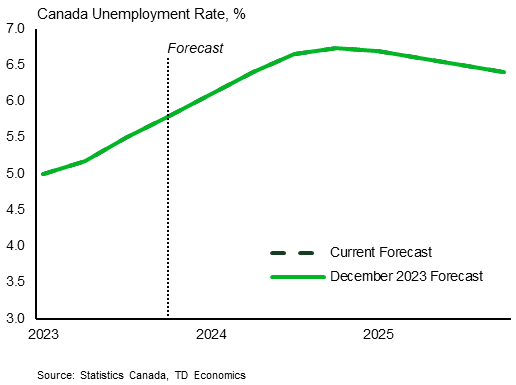
This is the exact opposite story to Canada, where much of the anticipated one-percentage point lift in the unemployment rate this year is due to the labor force outstripping job demand by a factor of two.
By the way, your eyes are not deceiving you, there are two lines plotted but are on top of each other because this forecast is behaving as expected and requires no adjustment.
The Canadian forecast also differs from the U.S. by incorporating outright job losses, which is a little harder to envision south of the border because of this next graph.
And For The Rebalancing Of The Labor Market
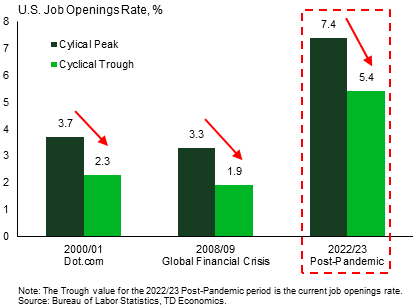
A big motivator on the U.S. forecast change is related to a very slow normalization in job openings, far slower than we anticipated that’s again out of step to history.
This graph captures the inverse relationship between job openings and the unemployment rate. Economists refer to this dynamic as the Beveridge curve.
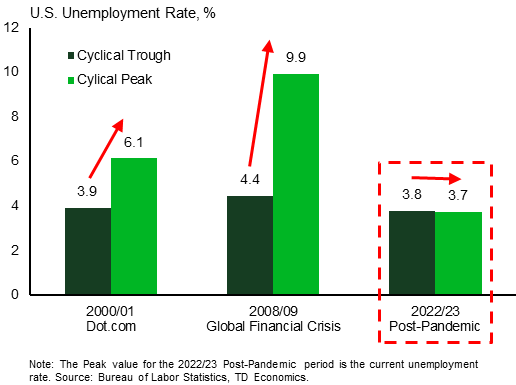
Although job demand has come down two percentage points in this cycle, which is more so than the prior two periods, the unemployment rate hasn’t budged.
Once again, an area of exceptionalism. That’s because it’s not just about direction, but also the starting point.
The job opening rate is currently sitting at 5.4%, and this is still two percentage points higher than the peak of both of the previous cycles. The unemployment rate won’t rise by a meaningful extent until certain thresholds are first met, and we’re still a ways off from that moment.
Still A Case For U.S. Consumer Spending to Slow…
So why do we still hold to the tenant that the economy will slow in 2024 as each quarter moves forward? There is some groundwork already being laid. As time passes, higher interest rates are leaving a mark on household finances despite solid job conditions.
First, consumer spending is now outpacing income by a wide margin, leaving households increasingly reliant on credit – evidenced by rising credit card utilization rates. Likewise, the savings rate has plummeted and is below levels observed before the pandemic.
Second, excess savings for low-to-middle income households is largely exhausted, in addition to millions of households now resuming student loan repayments after a 3-year moratorium. Payments to the department of education have increased 5-fold since the Supreme Court Decision and the ending of forbearance.
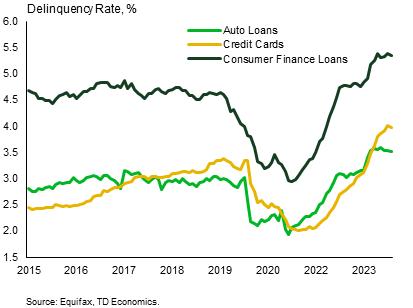
And third, as this graph shows, rising delinquency rates for credit card and autos suggest some strain is already being reflected by select households.
In other words, the lags from interest rates into the economy are certainly longer in this cycle but have not disappeared. As time goes on, consumer spending has fewer extraordinary growth-impulses to draw from.
But all of this still falls into the soft-landing or even into the glide-path camp.
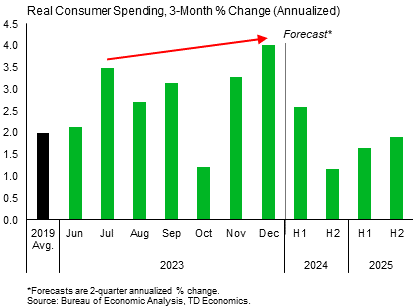
…But Defiant Consumer Is A Risk For Demand-Push Inflation
There’s no sense that a cliff is in the waiting, and that’s why our U.S. forecast on consumer spending doesn’t reflect a retrenchment. And financial markets are quickly adjusting to this reality. In mid-January, markets had priced 134 basis points in interest rate cuts by year end, and in mid-February that stood at about 90 to 100 basis points. Our view had always been centered on no more than 100 basis points and a later start-period at mid-year than markets had initially priced. In essence, the market view and ours have now collapsed onto each other.
Remember, the Federal Reserve has only penciled in 75 basis points in cuts this year, so we may still be at the upper end of what’s possible given the degree of economic resilience, the lack of capitulation in service prices and the risk that the deflationary benefit of goods prices comes to an end under geopolitical risks.
Canada’s Inflation Reality = Fewer Products Have Price Surges
Switching to Canada’s inflationary landscape, it has several parallels to the U.S.
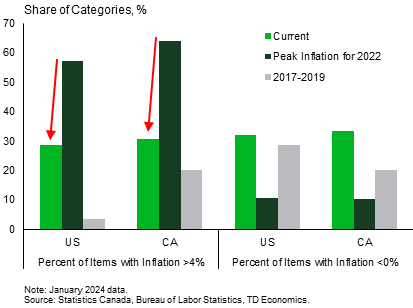
We’ve seen a significant reduction in the number of products with prices expanding by 4% or more, although the share is still elevated compared to pre-pandemic conditions.
At the other end of the spectrum, there’s also been a jump in the number of products in deflation, and for Canada it’s even more so than the pre-pandemic period.
This is all good news except, unfortunately, Canada suffers from a distortion in the measurement of CPI due to a heavier emphasis on shelter costs than peer countries. High shelter inflation is the single biggest factor preventing the Bank of Canada (BoC) from achieving its 2% inflation target. Shelter accounts for around two-thirds of the products and services rising above 4% within the Bank of Canada’s preferred core inflation metrics.
Canada’s Inflation Metrics Have A Methodology Problem
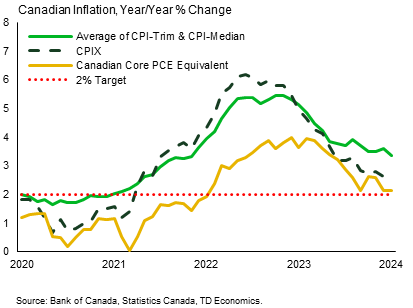
This graph shows the manifestation within the BoC’s preferred trim and median metrics.
Let’s back up for a minute to talk about why this is unique for Canada.
Shelter captures rent costs, as do many other international inflation metrics, so nothing unusual there. But it differs in two key areas to peer countries. The first is with the inclusion of mortgage interest costs, which is not the case with peers. The second is that population growth is three times that of peers leaving Canada with a higher degree of structural housing shortages and related cost-push pressures.
Many people assume the BoC’s trimmed inflation metric removes the influence of shelter because it would be “trimmed off” at the high end of price gains. This isn’t always the case, because it carries too large of a weight that can cause it to still be captured in the preferred metrics.
In contrast, the CPIX metric carries a different implication for the path of monetary policy. It was the BoC’s preference guide between 2001 to 2016. It strips out the 8 most volatile movements in prices that are not representative of broader economic trends within the consumer basket, as well as indirect taxes and, most importantly, mortgage interest costs. The BoC had unfortunate timing in moving away from this metric because if they kept it, rate cuts would likely already be in consideration. The CPIX sits at only 2.4%.
And what’s even more interesting is using the weights of the Federal Reserve’s preferred metric – core PCE inflation – for Canada. It sits at just 2.1% y/y. In other words, it’s already at target
So now we have a big-picture sense on how subjective a 5% policy rate is as the appropriate setting for the entire economy, because the last two metrics argue that it is already too restrictive. And this is why we penned a paper in January that ran through the math to show this point.
Returning to what we saw in January’s CPI data, if almost two-thirds of elevated inflation was due to shelter costs, then it goes against the very concept of inflation. By definition, inflation requires breadth to reflect economy-wide conditions, and therefore should not be dominated by a single sector.
The Area Of Largest Forecast Revision
However, here’s the flip side of that coin.
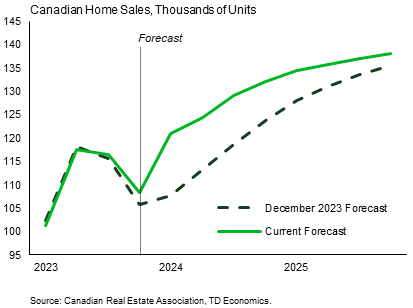
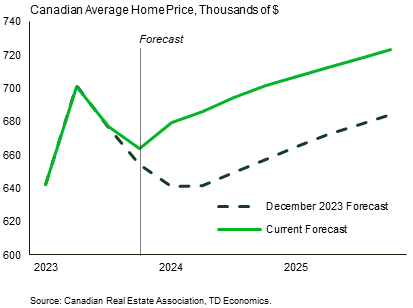
The one area in our forecast that has undergone a large upward revision is housing sales and prices. This is not an area that will easily let up in the inflation metrics. A modest move lower in borrowing costs in the fourth quarter of last year was enough to trigger an unexpected jump in housing activity (which, by the way, also occurred in the U.S.).
Home sales are outpacing our prior forecasts by a considerable margin. Favorable weather likely also played a role, and it’s possible that the winter surge in sales simply pulled forward activity from the spring selling season. But we don’t know for sure.
What we do know is that the Canadian housing market acts like a coiled spring. Every time pressure is released, it pops back up because the structural demand and supply imbalances are too severe. So, a shift in the BoC monetary policy stance could easily throw more fuel onto this fire.
This means that the argument on cutting rates this year and looking past shelter costs is not an argument to bring rates back to stimulative levels within the economy. It’s an argument to “right size” the policy rate to the entire economy. That’s why forecasts call for only 100-150 basis points in rate cuts despite a weak economy. This leaves the policy rate in restrictive territory but gives a bit more balance.
Canada’s Immigration Policy Tweak Helps But Not A Cure…
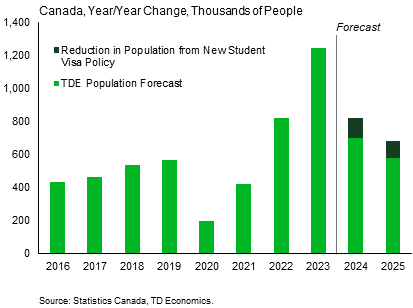
And if you think the recent changes to immigration policy will ride to the rescue of the Bank of Canada in solving for structural housing shortages...think again.
This is the magnitude of the changes announced so far with a targeted 35% reduction of study permit approvals, which is equivalent to about 220k fewer students. Population growth would still widely outpace housing construction.
Carries Modest Forecast Tweaks
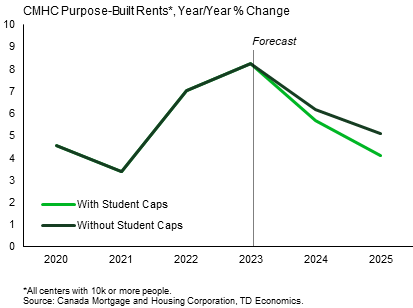
And here’s our estimate on its impact of rent costs and home sales. A deceleration in rent is already cued up in the data, but from very high levels. What’s more, rent tends to decelerate at a gradual or even pace. For example, from 2019 to 2021, purpose-built rent only slowed from 5% to 3%, even though the bottom fell out of population growth during the pandemic.
The second graph shows that the direct impact on sales is estimated to be very low. CMHC data indicated that only 3% of mortgages were issued to non-permanent residents back in 2016.
The Federal government is hinting at more changes to come on immigration. Mark Miller has indicated an intention to curb Canada’s dependance on temporary foreign workers through a review of the program. Should this occur, it would further help with the adjustment in shelter inflation, but this is an argument that most of the changes would impact the economy in 2025 rather than immediately. In other words, nothing has changed in our view. The Bank of Canada should start cutting rates this year, but the true act of policy normalization is a 2025 story.

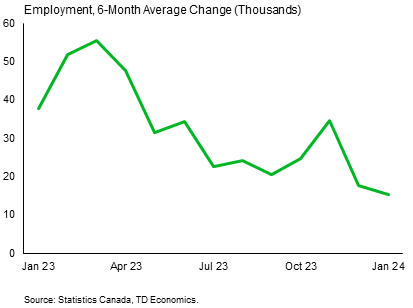
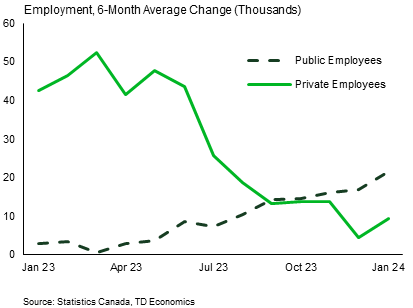
Canadian Job Market Keeps Fraying Beneath Surface
And on that front, we are getting clear signs that job demand is quickly decelerating. The downtrend over the past six months is occurring on the back of the private sector and is a critical hint that the backbone of the economy is bending.
The industry reach of softening labor demand has been wide and is within highly cyclical sectors that include manufacturing, construction, retail, wholesale trade, finance, real estate, recreation, and accommodation.
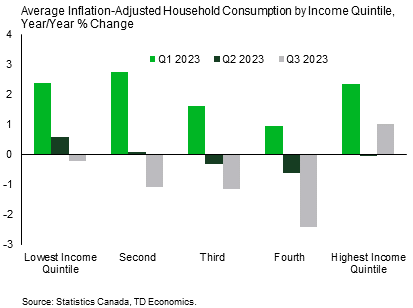
Canadian Families Already Economizing
And Canadian families are showing more cautious spending.
Looking at the data with more granularity by breaking it down into income quintile shows a clear trend. With each successive quarter, the spending patterns are being driven by a narrower slice of households at the top quintile.
It’s not too surprising that the top 20% are holding in, considering that these families were less affected by the termination of government pandemic supports, and their net investment income was boosted by higher interest rates and a lower debt burden. But that doesn’t speak to the health of the broader economy. Per capita consumption has contracted in four of the last five quarters.
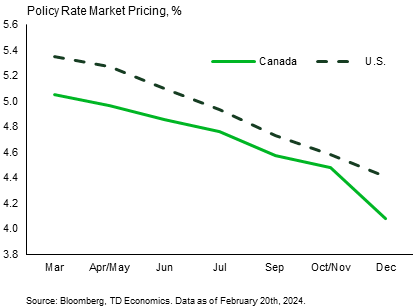
Market Pricing Has Strong Parallels
Which brings me to the final graph. The Bank of Canada and Federal Reserve are in opposite worlds with their economies, but both carry similar messaging to markets.
- The policy rate has already peaked.
- Patience is required.
- It’s realistic to expect some easing in policy this year, but both central banks remain non-descript on the timing or magnitude.
Financial markets are paying attention to this messaging and have meaningfully altered their rate cut expectations since the start of the year. For the US, expectations have been scaled back to remove nearly two cuts from the path in 2024. For Canada, it’s gone in the other direction where a rate cuts were magnified to reflect a weaker economy and a positive inflation report in January.
I think the market has it broadly right. It never made sense why the U.S. was priced so heavily, while Canada had the light touch. However, the U.S. still has the bigger burden of proof. It must show that either exceptionalism can be maintained on productivity and its link into inflation, or the economy will have to slow to growth patterns in the 1 to 1.5% range later this year. Right now, our forecast reflects the latter.
Disclaimer
This report is provided by TD Economics. It is for informational and educational purposes only as of the date of writing, and may not be appropriate for other purposes. The views and opinions expressed may change at any time based on market or other conditions and may not come to pass. This material is not intended to be relied upon as investment advice or recommendations, does not constitute a solicitation to buy or sell securities and should not be considered specific legal, investment or tax advice. The report does not provide material information about the business and affairs of TD Bank Group and the members of TD Economics are not spokespersons for TD Bank Group with respect to its business and affairs. The information contained in this report has been drawn from sources believed to be reliable, but is not guaranteed to be accurate or complete. This report contains economic analysis and views, including about future economic and financial markets performance. These are based on certain assumptions and other factors, and are subject to inherent risks and uncertainties. The actual outcome may be materially different. The Toronto-Dominion Bank and its affiliates and related entities that comprise the TD Bank Group are not liable for any errors or omissions in the information, analysis or views contained in this report, or for any loss or damage suffered.
Download
Print Version
Share this: