Questions? We've Got Answers
Addressing Issues Impacting the Economic and Financial Outlook
Date Published: May 19, 2026
As the conflict in the Middle East extends deeper into the year, this quarter's Q&A focuses on what it means for the global economy, inflation and interest rates. We also take a look at the risks creeping into private credit, job creation and where things stand on U.S. tariffs and the upcoming USMCA review. For Canada, we tackle whether various government policy initiatives can move the needle on investment and the struggling housing sector and potential economic impacts from the World Cup games.
- Q1. How much damage is the U.S.-Iran conflict inflicting on global growth?
- Q2. Do developments in private credit markets warrant concern?
- Q3. What's the risk of a 2022-style surge in inflation?
- Q4. What factors will blunt the economic headwinds from the global energy shock?
- Q5. What does it take for central banks to raise interest rates due to high energy prices?
- Q6. What's going on with job creation and what do economies need to grow?
- Q7. What is the outlook for tariffs and the USMCA review?
- Q8. Will Canadian government policy shifts help spur investment and growth?
- Q9. Are there recovery signs in Canada's housing market and can policies move the needle?
- Q10. The World Cup is coming, what's the impact on Canada's economy?
Q1. How much damage is the U.S.-Iran conflict inflicting on global growth?
A sharp oil supply shock has yet to upend the global economy. Higher energy prices and rising uncertainty have trimmed roughly 30 basis points from global growth expectations compared to prior to the conflict. Since the disruption to the Strait of Hormuz has persisted longer than expected since our March forecast, more modest forecast downgrades are in store for the U.S., Canada, Europe, and Japan by roughly 10-20 basis points — noticeable, but not severe. Policy support should help to soften part of the blow. In the U.S., for example, some of our downgrade in real GDP growth to 2.2% reflects the hit to household purchasing power from higher fuel costs. The drag could lessen if measures under discussion are adopted, such as a temporary federal gas tax holiday. In contrast, smaller Asian economies face bigger downgrades. The relatively modest economic impacts are grounded in a key assumption that the conflict resolves diplomatically by the end of the second quarter of 2026.
The economic resilience that’s unfolding is not an accident. Many economies entered 2026 with momentum and a few important buffers, including large oil inventories. In Asia, strong corporate profits linked to AI-related investment also helped cushion regions that are key manufacturing economies. Elsewhere, several countries most exposed to the supply shock entered this period with ample reserves, fiscal room, or access to alternative energy supply—including China and India. Strong first-quarter growth in China is helping to absorb some of the near-term hit, while India is also getting support from substantial tariff relief announced in the first quarter of 2026.
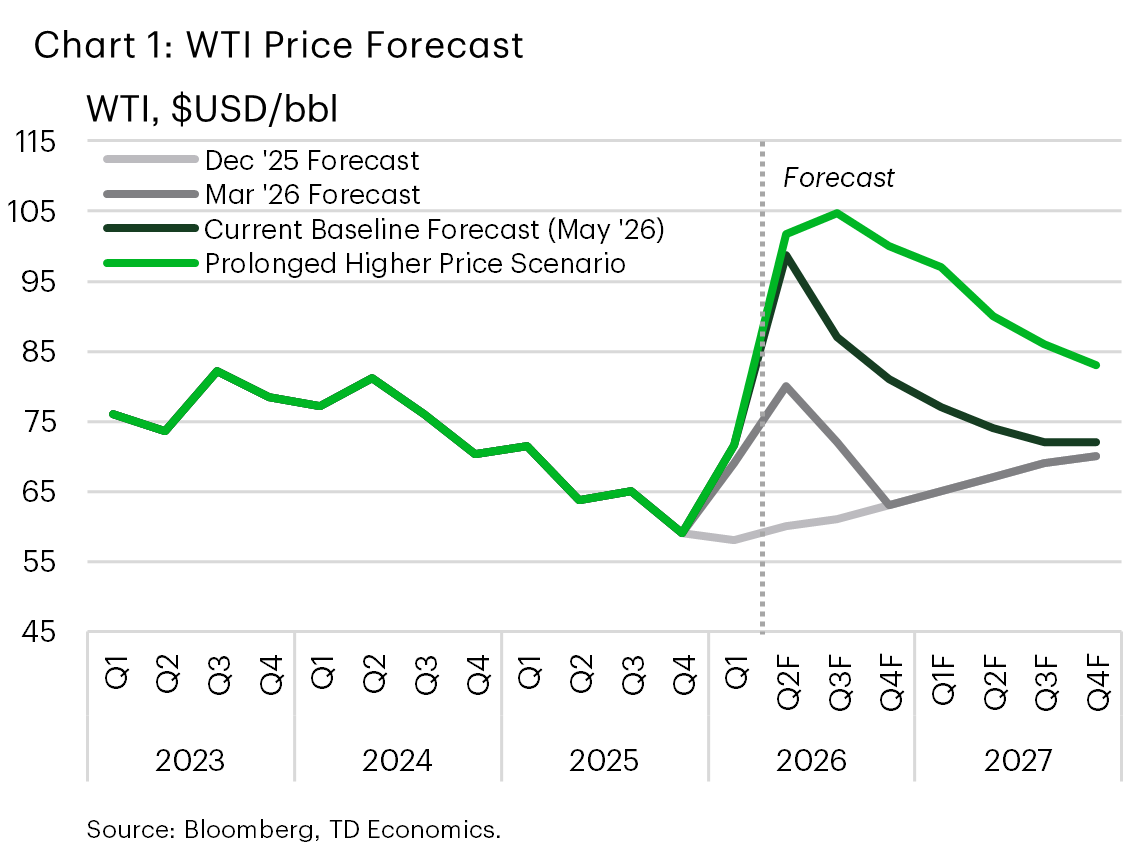
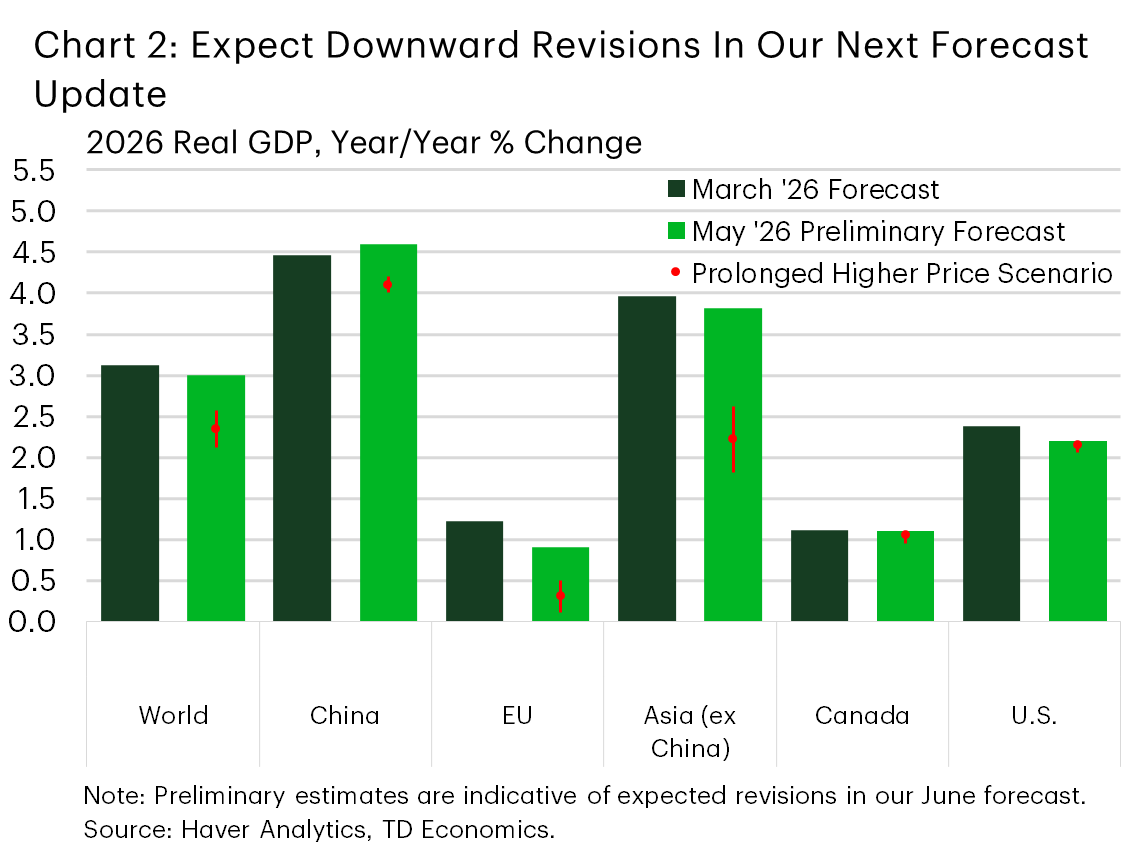
Our base case forecast sits on a strong assumption — some diplomatic progress occurs by late May, allowing flows through the Strait of Hormuz to recover gradually and oil prices to ease. But if tanker traffic stays disrupted into mid-year and crude remains above $100 per barrel, the economic hit deepens. Under a prolonged conflict scenario where oil prices average $100 this year rather than the $80 assumed in our baseline (Chart 1), global growth tumbles into the mid-2% range. That’s a far cry from the 3.1% of our March forecast and gets uncomfortably near to a broader downturn (Chart 2). Growth in the U.S. would slow further to 2.1% in 2026 with spillover into 2027, while Canada's economy would manifest a slight drag from an already uncomfortably low starting point. Likewise, a rise in recession fears that manifests into softer demand and tighter financial conditions would place central banks across the world in the cross hairs of responding to the higher inflation and related expectations. The odds would climb that they would need to respond with some modest interest rate hikes.
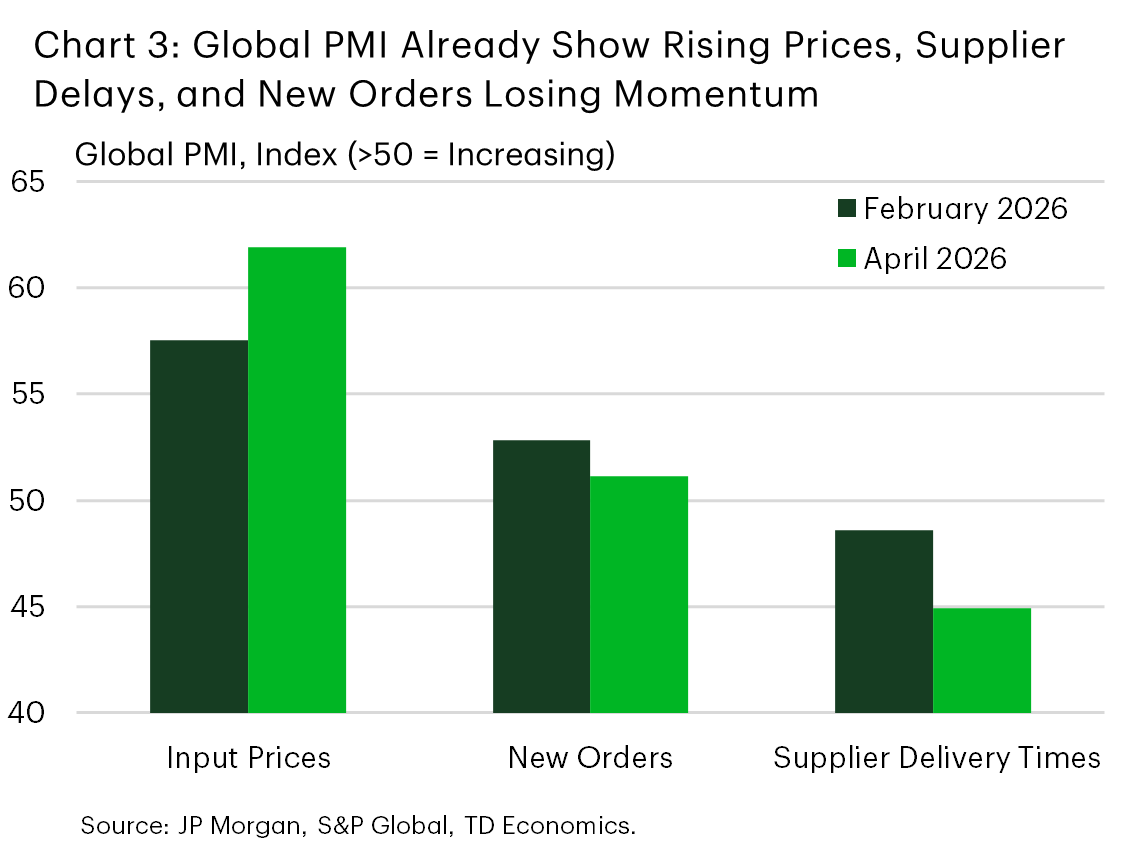
It will take time for official GDP data to show the full economic damage, so for now we are relying on faster-moving indicators. Among the most useful are manufacturing and services PMIs, especially new orders and input prices that give an early signal on demand and cost pressures. These surveys are already pointing to softer activity in Europe and rising input costs across most major economies. Globally, price pressures are building, delivery times are lengthening under strained supply chains, and new orders are weakening as higher costs squeeze demand and household incomes (Chart 3). Time is not our friend in this outlook. Global resilience hinges on one key unknown: how long the conflict lasts.
Q2. Do developments in private credit markets warrant concern?
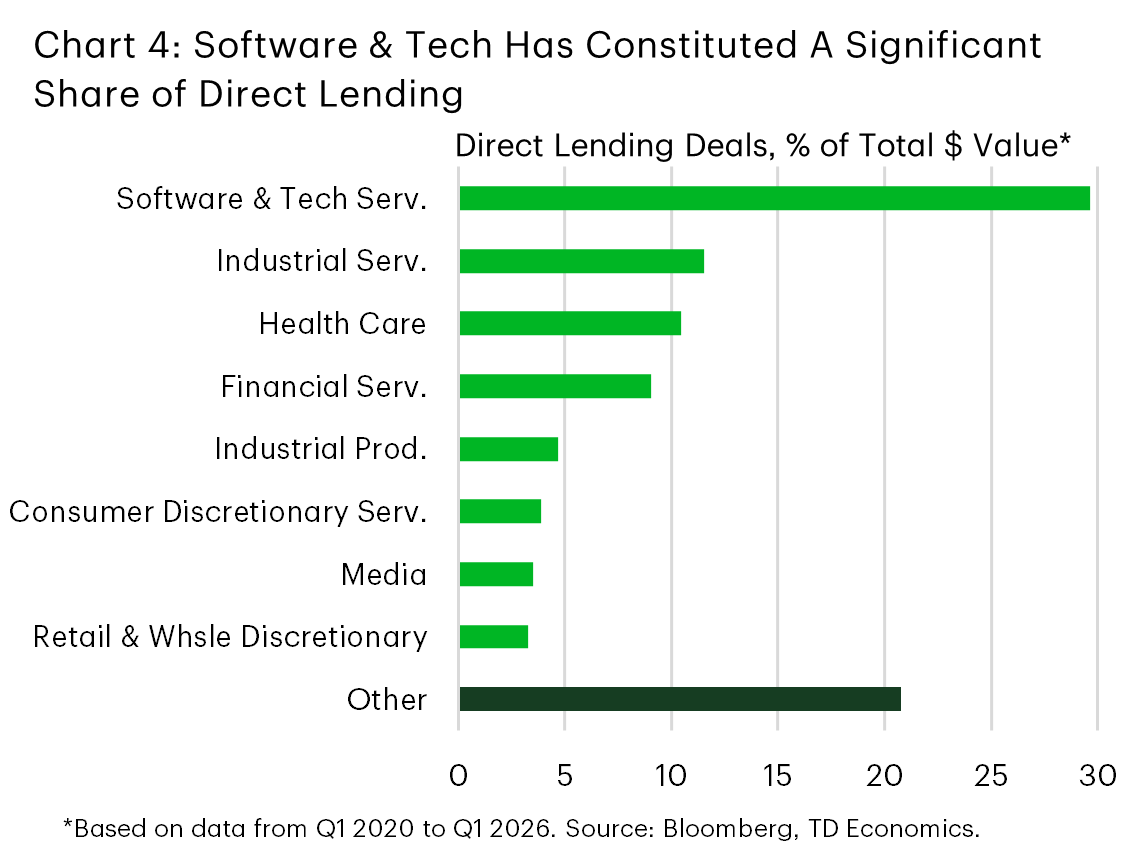
The U.S. private credit market has expanded to approximately $2 trillion, overtaking both the high-yield bond and syndicated loan markets. It now serves as a vital funding source for borrowers below investment grade. But recent bankruptcies and retail withdrawals from Business Development Companies (BDCs) have heightened concerns around valuations, liquidity, and sector concentration.
- Key risks include opaque valuations, limited liquidity, and significant concentration in software and technology borrowers (Chart 4).
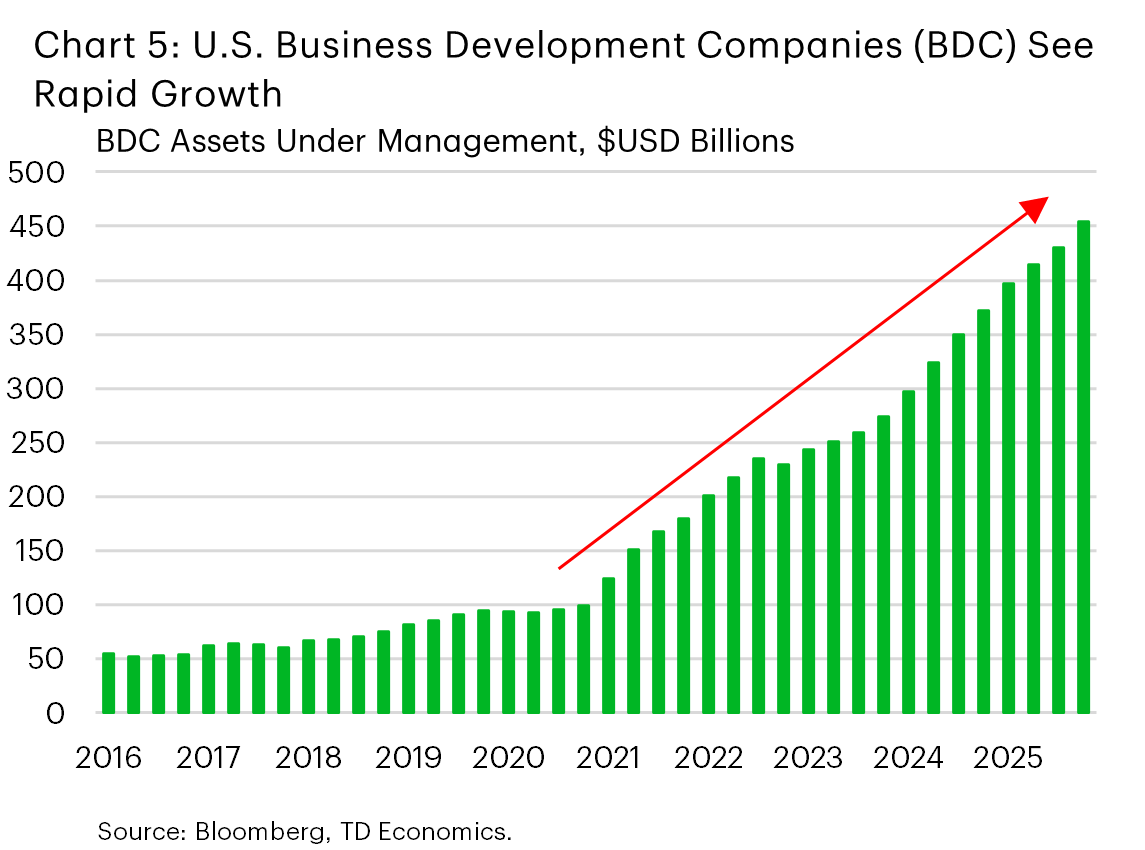
- Retail investor participation has increased through semi-liquid BDCs, making the market more sensitive to negative headlines and redemption pressures (Chart 5).
Currently, developments in private credit markets remain contained with liabilities less susceptible to rapid withdrawal. Some added comfort stems from private credit being only 14% of nonfinancial corporate debt and household exposure being minimal. BDC holdings account for less than 0.5% of total household financial assets. The risk of mass withdrawals is mitigated by retail-facing non-traded funds capping quarterly redemptions, and institutional investors — who dominate the market — typically having capital locked up for several years. This structure argues for some orderly liquidation of assets should redemption or funding pressures persist.
By extension, it would be difficult for stress in private credit to be the sole source to destabilize the financial system. In a severe scenario with default rates rising to 10%, this would translate into $200 billion in defaults. Assuming a conservative 40% recovery rate, losses would be approximately $120 billion, likely leading to only a modest drag on GDP and lending1. However, the main risk stems from indirect transmission channels linked to liquidity and financial conditions, particularly through counterparty exposure. The Office of Financial Research estimates $410–$540 billion in bank and non-bank debt financing for private credit funds and BDCs, plus roughly $300 billion in uncalled commitments from investors such as pension funds and insurers. For pensions, stress would materialize through increased capital calls by fund managers, and losses on private credit investments could put pressure on funding ratios or regulatory capital, potentially resulting in asset sales, such as equities and bonds, to rebalance portfolios.
For the time being, private credit doesn’t seem to be a primary trigger for significant macroeconomic spillovers but could escalate if compounded by higher credit spreads due to AI-related uncertainty or repricing of AI-related companies. A broader tightening of financial conditions would pose larger risks.
Q3. What's the risk of a 2022-style surge in inflation?
There are no two ways around it, inflation is rising and will continue to do so in the near term. A doubling in oil prices, a 30% increase in diesel prices and shortages in jet fuel are filtering into the prices consumer pay. And that's just the beginning. Right now we are mostly seeing first-order effects on prices directly tied to these products, but the impact will broaden to second-order effects within broad production and transportation supply chains.
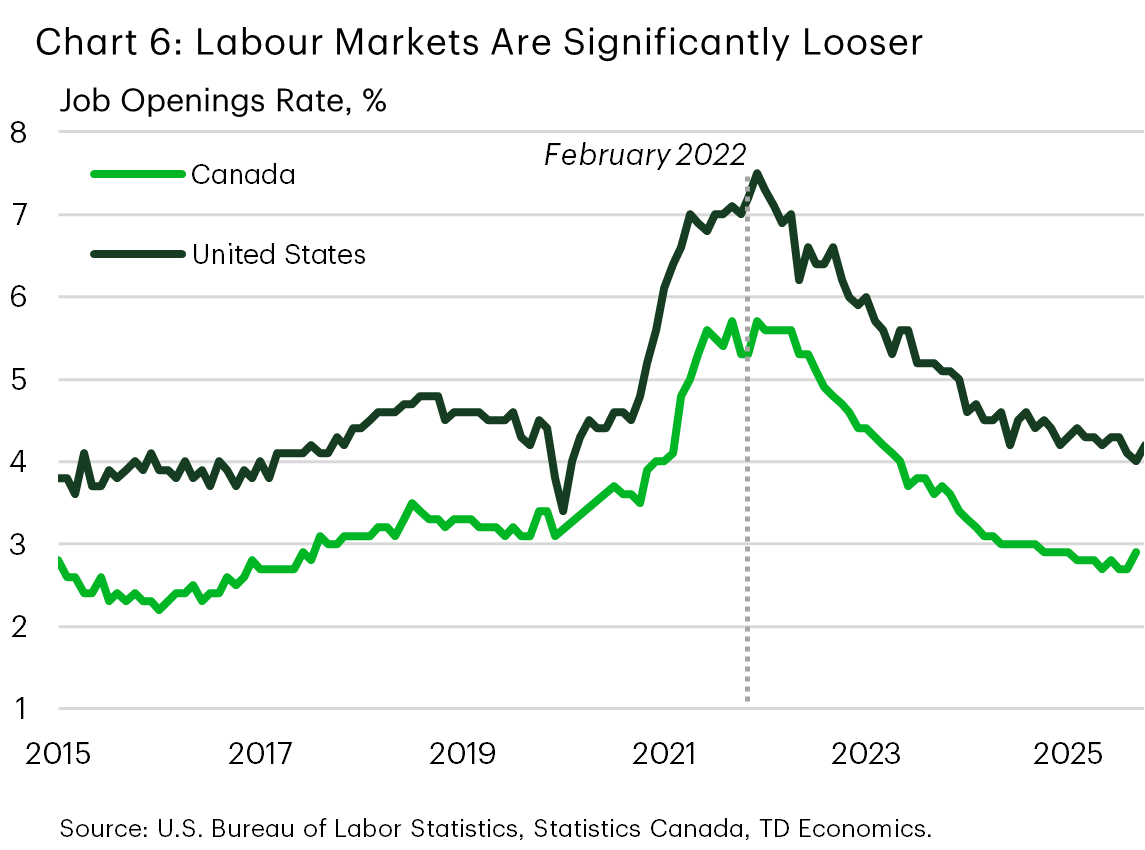
There are several key distinguishing factors today versus 2022. Although energy prices are surging and supply chains are snarled, the magnitude and scope on goods and services is to a far lesser extent compared to 2022. In addition, this cycle lacks the "revenge spending" boom that accompanied the reopening of global economies that were fuelled by excess pandemic-era savings. And lastly, labour demand is much weaker than post-pandemic when firms were under pressure to quickly rebuild workforces to meet surging demand (Chart 6). This means far fewer people switching jobs in search of higher wages that pressured employers to pass along those costs to consumers.
We expect the oil supply shock to boost CPI inflation to average 3.6% and 2.7% in the U.S. and Canada, respectively, this year. Markedly higher than the 2.8% and 2.2% projected last December. However, the bleed-through to core prices should be more muted than in 2022 with the demand side of the equation in a very different place.
Lastly, central banks will be more reactive this time around to quell runaway prices. The pandemic was a once in a century economic disruption, whose effects were not well understood. The word “transitory” frequently described the jump in inflationary pressures, which proved incorrect. The lens of central banks was also blurred by a decade of weak inflation that pre-dated the pandemic and created a bias towards a “wait-and-see” approach on inflation. With their credibility subsequently undermined, policymakers won’t want to make the same mistake again. Many are already sending clear signals that rate hikes will be in the queue if the energy shock does not dissipate. Central banks will set a lower ceiling on what they are willing to tolerate in inflation compared to in 2022.
Q4. What factors will blunt the economic headwinds from the global energy shock?
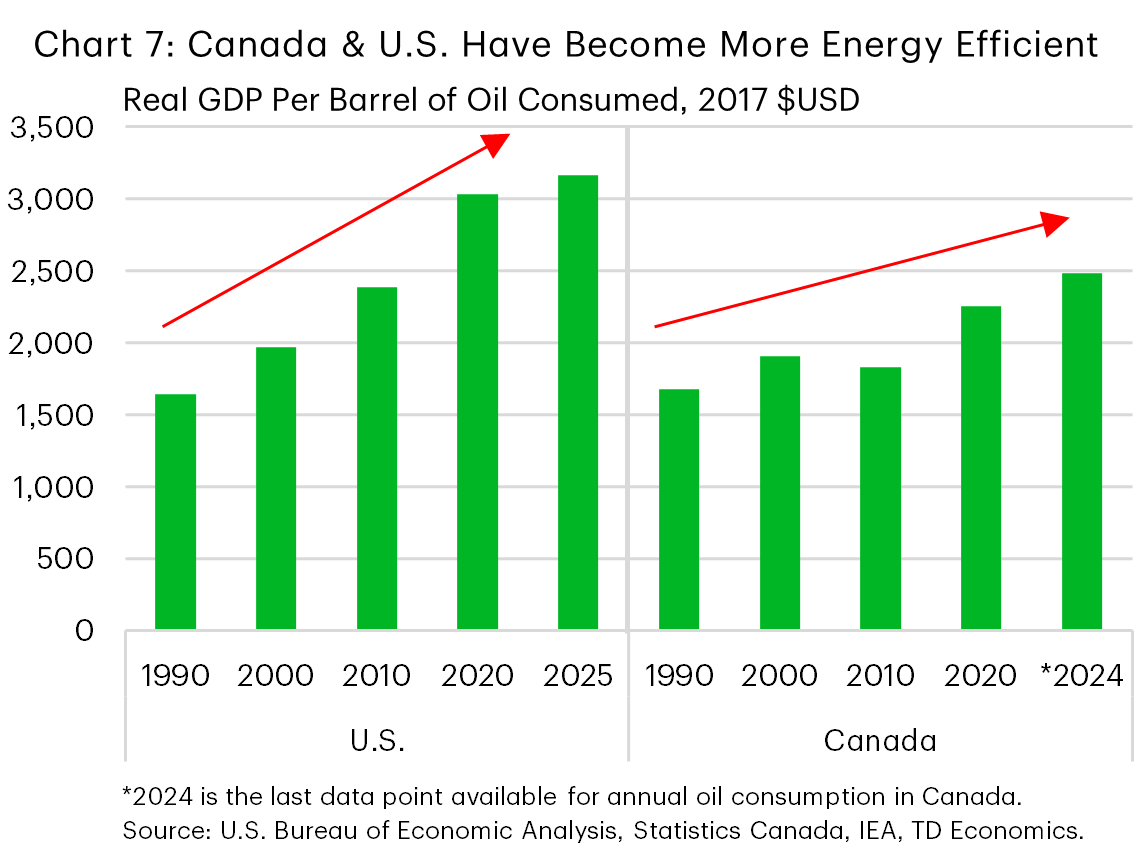
As discussed in Question 1, the economic impacts to the U.S. and Canada are smaller relative to Europe and Asia. The shale revolution in the U.S. during the mid-2000s has shifted the dynamics from being an energy importer to a small net exporter, while simultaneously becoming more energy efficient. In Canada, the energy sector has long been a driving force of the economy, accounting for nearly 7% of overall output – roughly twice that of the U.S. From a growth standpoint, this means that energy shocks have historically been a double-edged sword. On one side, a spike in energy prices erodes household purchasing power and raises business input costs – a headwind to output. But on the other edge, it boosts revenues for energy producers (and tax revenues for governments), helping to mitigate the overall hit to growth. This is happening at a time when both the U.S. and Canada have become less energy intensive, reflecting a transition to more service driven economies and better energy efficiency (Chart 7).
Beyond the structural factors, American households are well positioned to absorb the energy shock. OBBBA tax cuts are retroactive through 2025, boosting the average household tax refund by about $350. Then there’s the added benefit flowing from the elimination of taxes on tips and overtime pay. Couple these with a labour market showing early signs of strengthening and, normally, you'd have a recipe for a consumer to weather the energy price shock. However, we can also readily observe through sentiment indicators that American consumers are highly price-sensitive in areas of food, gasoline and other items purchased at a higher frequency. As such, this price shock will test the narrative of consumer resilience. We expect U.S. consumer spending growth to hold below 2% in real terms through most of 2026. This speaks of resilience but also marks a step down from 2025's pace.
In Canada, the economic effects will be uneven across the country. Energy producing regions will directly benefit from higher oil prices through corporate profits and government revenues. In turn, this could fuel stronger hiring, wages, and overall economic activity across those regions. Conversely, energy importing regions, like Ontario and Quebec, will face the adverse effects of higher energy prices – leaving them worse off. The federal gas tax holiday offered some temporary relief at the pump, but absent declines in oil prices, it only serves to blunt the near-term direct impact and will do little to offset the secondary effects to consumers should higher prices be transmitted more broadly to food and other items. For now, we view the energy shock netting as neutral for the overall Canadian economy, but consumer spending growth is likely to run between 1-1.5% in real terms this year, also below last year's pace. Absent from the forecast is a large lift to business investment related to oil prices. This represents a possible upside to 2027 growth amid the federal government's push to speed up timelines and increase its "pro-investment credibility" along with recent headlines of investments in gas infrastructure and energy firm acquisitions.
Q5. What does it take for central banks to raise interest rates due to high energy prices?
Our view remains that the Federal Reserve (Fed) and the Bank of Canada (BoC) will continue to look through the energy shock if it resolves by June or in short-order. However, the Fed has less runway in showing patience than the BoC.
Prior to the war, U.S. core inflation was running at a robust 4.3% (quarter-on-quarter annualized) through the first quarter. This leaves the economy with a less favourable jump-off to absorb added price pressures. One positive is that the easing cycle was interrupted and a fed funds rate at 3.75% is still considered “restrictive”. It also sits above the median long-run estimate from the Fed's most recent Summary of Economic Projections (SEP). It’s this duality that caused us to remove our rate cut expectations for this year, but also not shift to a rate-hike stance. Assuming the war resolves in the next one to two months, the window would open again for the Fed to resume rate cuts in early 2027 (see Table 1).
In Canada, things are a bit more clear-cut. Near-term measures of inflation are soft, with the BoC’s core measures averaging a mere 1.6% over the past three and six months. Prices are being capped by a weak labour market – the unemployment rate has been stuck between 6.5% and 7.1% since September 2024 – and businesses reporting limited ability to pass on higher costs to consumers. This creates more fertile ground for the BoC to sit on the sidelines through the end of the year, despite the policy rate pinned to the lower end of its neutral range (2.25%).
That said, as we note in Question 3, central bankers have been clear that they don't want 2026 to be a repeat experience of 2022. So patience will have its limits if severe energy disruptions from the war drags into the summer. To this point, the BoC's most recent monetary policy decision simply stated that should energy prices remain elevated and generate "ongoing realized inflation … there may be a need for consecutive increases in the policy rate".
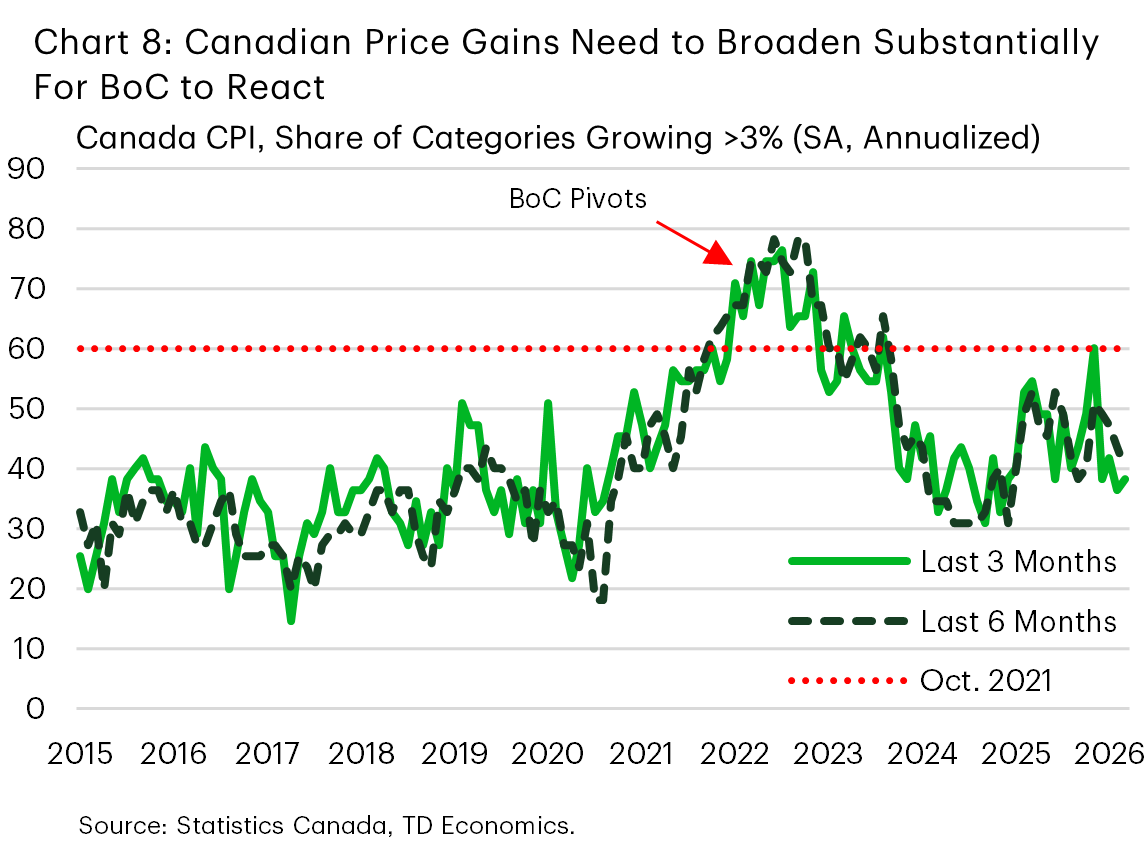
The exact tipping point that would prompt central banks to raise interest rates is uncertain. In October of 2021, when the Bank of Canada pivoted to a hawkish tone in its communications, the share of the CPI basket with three- and six-month price gains over 3% (annualized) was 60% and 62%, respectively (Chart 8). Today those figures are 44% and 40%. This doesn't offer much in the way of wiggle room, but it does provide a barometer of when a broadening in price pressures can no longer be ignored by central bankers.
In the U.S., there is still a substantial hurdle for the Fed to pivot from a prolonged pause to a hike. However, a dovish stance is increasingly strained by robust growth and broadening price pressures. For the Fed to pivot to rate hikes a few pillars would need to fall into place. These include a tightening in the labour market (i.e. lower unemployment rate and/or a sustained pick-up in job growth), together with accelerating core inflation measures and rising longer-term inflation expectations.
Q6. What's going on with job creation and what do economies need to grow?
Job creation in both Canada and the U.S. slowed notably through 2025, but fewer jobs are needed to stabilize the unemployment rate with immigration flows significantly reduced following a post-pandemic surge. This is most evident through labour force growth. Back in 2024, the pace of monthly job creation that would hold the unemployment rate steady (i.e., the breakeven rate) was estimated at 50k in Canada and 150k in the U.S. Today, those figures have fallen to slightly below zero in Canada and 30k in the U.S.. In other words, there’s a significantly lower bar for what a "good" monthly job figure looks like. And, with both the U.S. and Canada contending with aging demographics and slower immigration, lower job numbers are the new norm.
Despite this low bar, Canadian employment growth has not been able to reach it, resulting in ample slack in the labour market. The unemployment rate at 6.9% is roughly a percentage point above where it would be in a balanced labour market. That’s because employment declines have averaged 28k per month since December, resulting in no advancement in jobs over an entire year when the lens is pulled back further. Conversely, while U.S. payrolls are only 0.2% larger than last year, the pace has accelerated to average 76k new positions per month since December. Although the unemployment rate has held steady in a tight 4.3%-4.4% range, this is only a sliver above its long-term target and a sign of tighter labour market conditions.
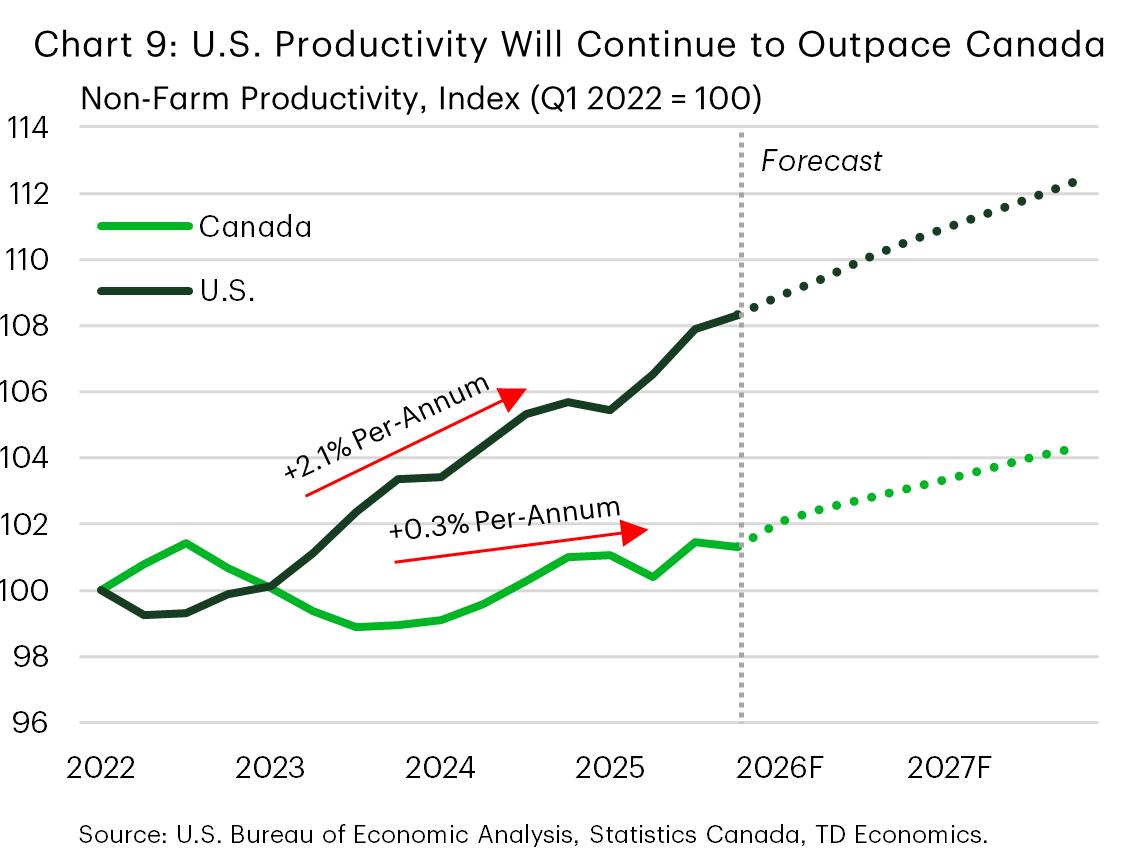
Lack of growth in the labour supply may be helpful for capping the unemployment rate, but it also means slower growth in hours worked, a key input to overall economic growth. Economists often talk about a concept called "potential growth" or the economy's sustainable, non-inflationary growth rate. Potential growth is typically decomposed into two core components: growth in labour input (hours worked) and productivity. Labour input will have minimal growth in Canada and in the U.S. over the near-term, raising the importance of productivity. Currently, Canada is weak across both components, and this combination translates into weak economic growth. But it's a different story in the U.S. where productivity has been running north of 2% annualized in recent years (Chart 9).
The ideal state is to have both levers engaged, which is what the U.S. has recently demonstrated. We anticipate the coming years will bring even stronger U.S. productivity growth amid broader adoption of AI. Although Canada should also benefit from a pick-up, there’s more urgency to do so since labour supply offers a stronger binding constraint.
Q7. What is the outlook for tariffs and the USMCA review?
The U.S. administration's response to the Supreme Court ruling against its use of the International Emergency Economic Powers Act (IEEPA) was swift. Within hours of the decision, it imposed a temporary 10% global tariff under Section 122 of the Trade Act of 1974, which will expire on July 24th. Section 122 tariffs are used to address large and persistent balance of payments deficits or defend the value of the U.S. dollar but can only last for five months. However, this alternative has also faced legal challenges, with the U.S. Court of International Trade ruling against the tariffs in early May.
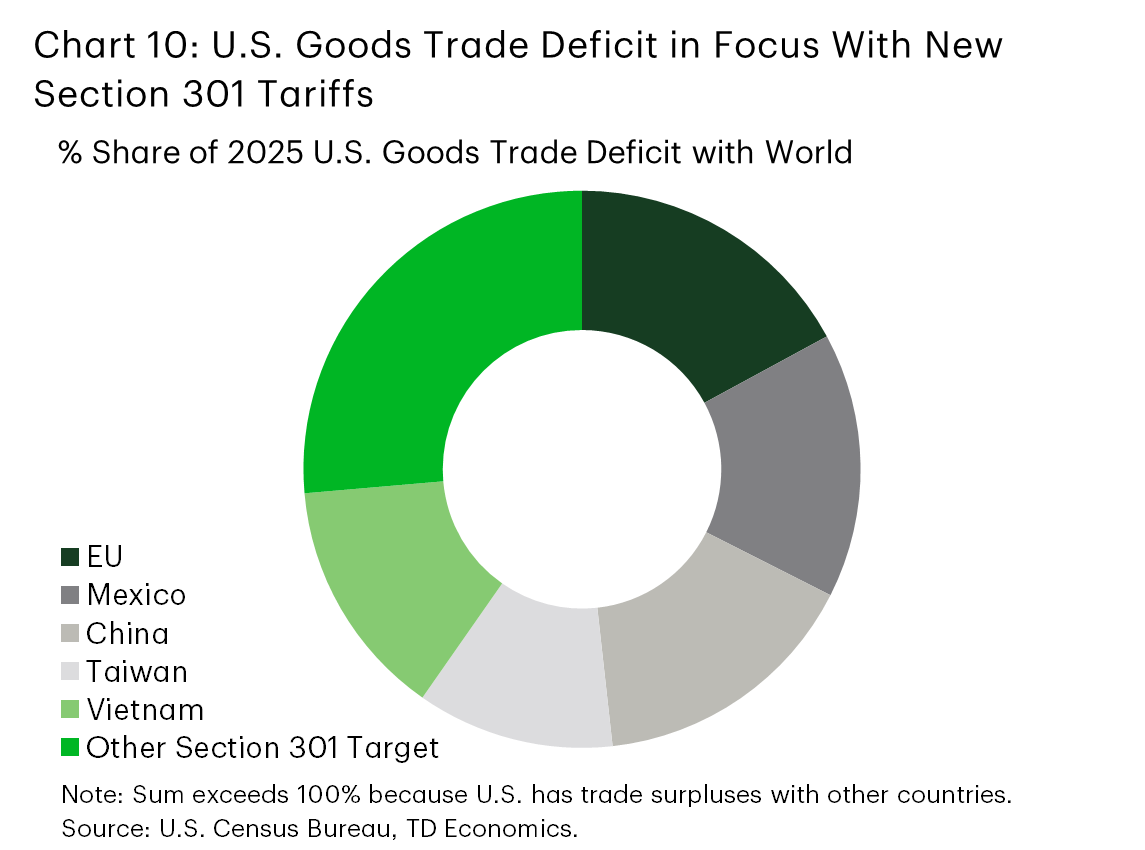
While this increases near-term tariff uncertainty, the administration is already considering more durable alternatives. A more permanent replacement is being explored under two Section 301 tariff investigations targeting over sixty nations. These tariffs are focused on anti-competitive trade practices that were previously only in effect against China. The first of the new investigations relates to allegations of excess production capacity in the E.U and 16 other countries. The cumulative net trade balance of these nations with the U.S. is roughly equal to the U.S. trade deficit with the world (Chart 10).
The second Section 301 tariff investigation reflects 60 separate investigations against 60 U.S. trading partners, all related to the same allegation of a failure to effectively prohibit the import of goods that were produced using forced labour. Historically, section 301 investigations have taken 12-18 months to complete, but the U.S. Trade Representative (USTR) is pursuing an accelerated schedule to maintain the administration's tariff regime beyond the timeline of the temporary Section 122 tariffs.
As these tariff developments continue to unfold, the first review of the USMCA is expected in July. With roughly a third of U.S. trade covered by the agreement, a material modification could have a significant impact on the North American economy. At this point in time, U.S. officials have suggested that the core elements of the agreement will remain intact, but we expect updates in areas like more stringent domestic content requirements, alignment on trade policies related to China, and stronger partnerships on areas of shared interest (i.e. critical minerals, energy, etc.). The USTR is expected to submit its plans for review to Congress by June 1st, with the formal review scheduled to follow one month later.
Although our expectation is that trade policy will remain broadly stable in 2026, the numerous developments will keep policy uncertainty elevated. The USMCA review is likely to be challenging and could weigh on business sentiment in all three countries. While the potential threat of withdrawal from the agreement is likely a distant tail risk, mired by legal questions, threats could quickly feed through to business hiring and investment intentions. Currently, the most probable outcome is for the core of the agreement to remain in effect, with concessions offered by Canada and Mexico in exchange for some reduction in certain Section 232 tariffs.
Q8. Will Canadian government policy shifts help spur investment and growth?
Prime Minister Carney has emphasized that the federal government's ambition is to get the country "back" to building "big things". To achieve this, they are using three levers. The most prominent is the Major Projects Office, which was initially established to deliver government decisions on designated projects within two years. However, the federal government recently went further, launching a 30-day consultation on regulatory and legislative changes to shorten project review and decision timelines to one year, and to create "federal economic zones" for development, coordinate consultation with Indigenous communities, and other proposed changes. Streamlining regulatory requirements to speed infrastructure development could prove transformational, but is only likely to deliver its main economic benefits over the medium-term.
With the impact of U.S. tariffs still being felt, the federal government has deployed two more immediate measures to get investment dollars out. The first is to raise spending on defense and public infrastructure. On defense, billions are allocated to base and cyber infrastructure and the development of a domestic defense industrial strategy, although some equipment will be imported dampening the impact on Canada's economy. For public infrastructure more broadly, billions are allocated over the next five years for things ranging from hospitals to transportation infrastructure. An increasing number of firms in the Business Outlook Survey (BOS) reported that the initiatives were "supporting their sales outlooks".
Changes on the tax front have been smaller. The expansion of the Scientific Research & Development credits, and a rebranded and expanded eligibility for immediate expensing of capital investments (Productivity Super-Deduction) were announced in Budget 2025 with the goal to lower the marginal tax rate for new investments.
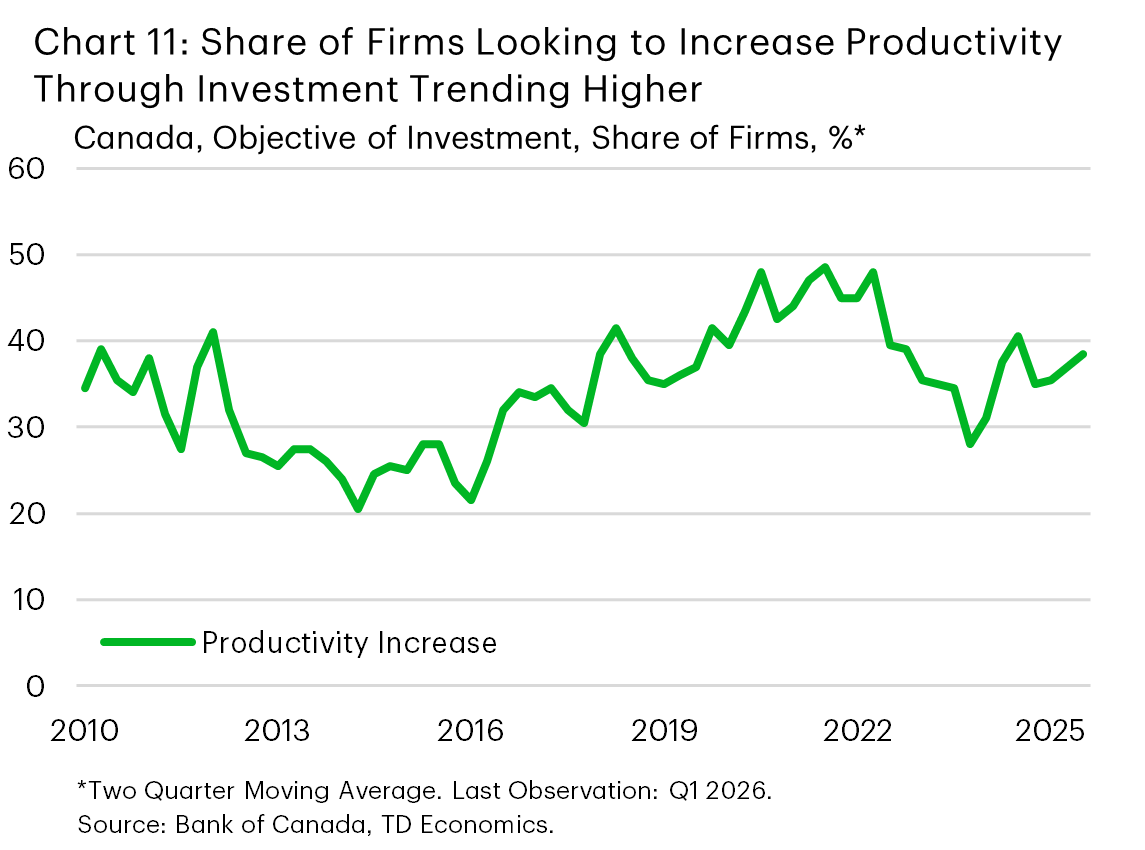
The Government is looking to lay the groundwork for long-term growth, and new policies may struggle to lift investment in the here-and-now as outlays languish from the effects of the trade war. This leaves us expecting that business investment will register meagre growth in 2026 after last year's contraction. However, in a sign that things may have started to turn a corner, the BOS showed a notable improvement in investment intentions prior to the war in the Middle East. Even more encouraging was that the share of respondents prioritizing productivity enhancing investments continued to trend higher (Chart 11). Coupled with the adoption of artificial intelligence, increased outlays on productivity enhancing capital could begin to help reverse Canada's multi-year productivity malaise, which is crucial for Canada to find success amidst the changing policy and economic environment (as we noted in Question 6).
Q9. Are there recovery signs in Canada's housing market and can policies move the needle?
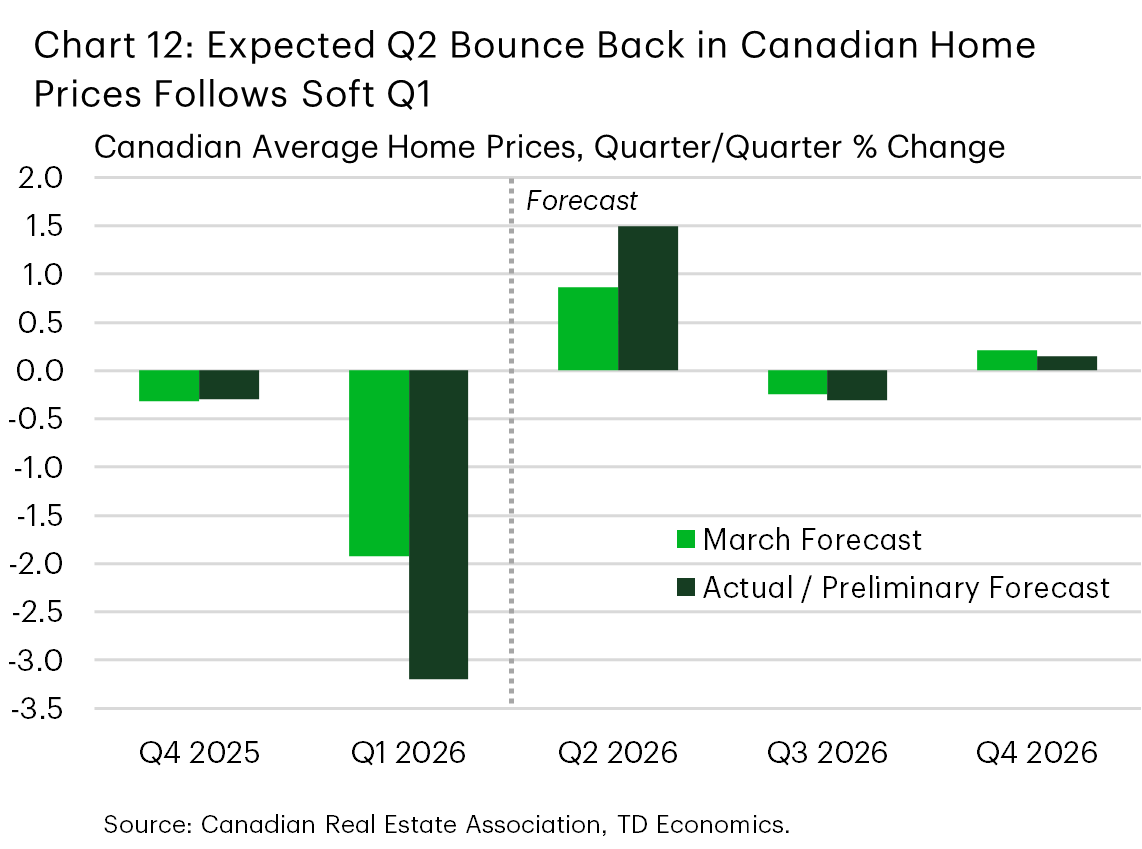
Early data for the second quarter has been consistent with our March forecast, which called for gains in Canadian sales and average prices in Q2. However, this only partially offsets a weak first quarter (Chart 12), particularly in B.C. and Ontario. Alberta is also cooling from elevated levels, tempering price momentum in that market.
Our outlook remains for a gradual, modest housing recovery. On the plus side, there's some degree of pent-up demand in the resale market after a two-year lull in sales with little churn in the market. However, the weak job market and slower population growth create a cautionary environment that limits a snap back even if economic uncertainty suddenly lifts. We estimate 2027 will see the housing market gain more traction on improved economic conditions and better affordability in Ontario and B.C, particularly if CUSMA concerns fade. Interest rate shifts are not anticipated to be material to this outcome, with the Bank of Canada expected to remain on hold.
On the policy front, recently enacted measures include a federal GST cut on new homes for first-time buyers, and two Ontario-specific measures. These are a joint federal–Ontario initiative to remove HST on new homes for all buyers, and a new $8.8 billion plan to reduce municipal development charges by up to 50% over three years, both efforts to improve housing affordability. The GST cut is now in force, while Ontario’s HST relief is pending implementation. These measures should support new home sales (through lower prices), which would be consistent with evidence from the economic literature, and ultimately contribute to an expansion in the housing supply.
That said, the new home segment faces the same demand headwinds as the resale market - including a soft labour backdrop, recent price declines (which keep buyers sidelined as they wait for cheaper entry points), slower population growth, cost-of-living pressures, and elevated economic uncertainty. These measures could also impact the resale market on the margin, by disproportionately pulling demand towards new homes.
Q10. The World Cup is coming, what's the impact on Canada's economy?
As 13 games kick-off in Toronto and Vancouver in June, the positive national economic effects are expected to be small but the regional effects will be well timed to offer some economic relief.
Primarily, we expect to see a temporary rise in demand and inflation as prices for hotels, restaurants, and recreational activities rise to coincide with the event, as was seen with other tourist draws, like the Taylor Swift Era's tour. This will be barely noticeable in the overall data, but comes at a time when BC and Ontario are absorbing the brunt of the negative impacts from trade and energy shocks. In Ontario, GDP could see a temporary 0.2% q/q (annualized) lift. In BC, the quarterly effect could be as large as 0.5% q/q. Although these effects would be transitory, and wash out in the annual figure, the growth impulse can serve as a salve to temporarily alleviate the pain from the other economic ailments.
Tables
Table 1: Interest Rate Outlook
| Interest Rates | 2025 | 2026 | 2027 | |||||||||
| Q1 | Q2 | Q3 | Q4 | Q1 | Q2F | Q3F | Q4F | Q1F | Q2F | Q3F | Q4F | |
| CANADA | ||||||||||||
| Overnight Target Rate | 2.75 | 2.75 | 2.50 | 2.25 | 2.25 | 2.25 | 2.25 | 2.25 | 2.25 | 2.25 | 2.25 | 2.25 |
| 3-mth T-Bill Rate | 2.62 | 2.65 | 2.42 | 2.15 | 2.31 | 2.25 | 2.25 | 2.25 | 2.25 | 2.25 | 2.25 | 2.25 |
| 2-yr Govt. Bond Yield | 2.46 | 2.59 | 2.47 | 2.58 | 2.82 | 2.85 | 2.75 | 2.65 | 2.60 | 2.60 | 2.60 | 2.60 |
| 5-yr Govt. Bond Yield | 2.61 | 2.83 | 2.74 | 2.96 | 3.09 | 3.15 | 3.10 | 2.95 | 2.90 | 2.90 | 2.90 | 2.90 |
| 10-yr Govt. Bond Yield | 2.97 | 3.28 | 3.17 | 3.42 | 3.46 | 3.50 | 3.40 | 3.30 | 3.25 | 3.25 | 3.25 | 3.25 |
| 30-yr Govt. Bond Yield | 3.23 | 3.56 | 3.62 | 3.86 | 3.89 | 3.90 | 3.75 | 3.60 | 3.55 | 3.55 | 3.55 | 3.55 |
| 10-yr-2-yr Govt Spread | 0.51 | 0.69 | 0.70 | 0.84 | 0.64 | 0.65 | 0.65 | 0.65 | 0.65 | 0.65 | 0.65 | 0.65 |
| U.S. | ||||||||||||
| Fed Funds Target Rate | 4.50 | 4.50 | 4.25 | 3.75 | 3.75 | 3.75 | 3.75 | 3.75 | 3.50 | 3.25 | 3.25 | 3.25 |
| 3-mth T-Bill Rate | 4.21 | 4.24 | 3.86 | 3.57 | 3.61 | 3.70 | 3.65 | 3.55 | 3.30 | 3.15 | 3.15 | 3.15 |
| 2-yr Govt. Bond Yield | 3.89 | 3.72 | 3.60 | 3.47 | 3.79 | 3.90 | 3.80 | 3.40 | 3.35 | 3.35 | 3.35 | 3.35 |
| 5-yr Govt. Bond Yield | 3.96 | 3.79 | 3.74 | 3.73 | 3.92 | 4.05 | 3.85 | 3.75 | 3.70 | 3.70 | 3.70 | 3.70 |
| 10-yr Govt. Bond Yield | 4.23 | 4.24 | 4.16 | 4.18 | 4.30 | 4.35 | 4.25 | 4.15 | 4.10 | 4.10 | 4.10 | 4.10 |
| 30-yr Govt. Bond Yield | 4.59 | 4.78 | 4.73 | 4.84 | 4.88 | 4.95 | 4.80 | 4.65 | 4.60 | 4.60 | 4.60 | 4.60 |
| 10-yr-2-yr Govt Spread | 0.34 | 0.52 | 0.56 | 0.71 | 0.51 | 0.45 | 0.45 | 0.75 | 0.75 | 0.75 | 0.75 | 0.75 |
| CANADA - U.S SPREADS | ||||||||||||
| Can - U.S. T-Bill Spread | -1.59 | -1.59 | -1.44 | -1.42 | -1.30 | -1.45 | -1.40 | -1.30 | -1.05 | -0.90 | -0.90 | -0.90 |
| Can - U.S. 10-Year Bond Spread | -1.26 | -0.96 | -0.99 | -0.76 | -0.84 | -0.85 | -0.85 | -0.85 | -0.85 | -0.85 | -0.85 | -0.85 |
End Notes
- Goldman Sachs research. "U.S. Daily: Putting Private Credit Risks in Macroeconomic Context". March 23, 2026.
For any media enquiries please contact Oriana Kobelak at 416-982-8061
Disclaimer
This report is provided by TD Economics. It is for informational and educational purposes only as of the date of writing, and may not be appropriate for other purposes. The views and opinions expressed may change at any time based on market or other conditions and may not come to pass. This material is not intended to be relied upon as investment advice or recommendations, does not constitute a solicitation to buy or sell securities and should not be considered specific legal, investment or tax advice. The report does not provide material information about the business and affairs of TD Bank Group and the members of TD Economics are not spokespersons for TD Bank Group with respect to its business and affairs. The information contained in this report has been drawn from sources believed to be reliable, but is not guaranteed to be accurate or complete. This report contains economic analysis and views, including about future economic and financial markets performance. These are based on certain assumptions and other factors, and are subject to inherent risks and uncertainties. The actual outcome may be materially different. The Toronto-Dominion Bank and its affiliates and related entities that comprise the TD Bank Group are not liable for any errors or omissions in the information, analysis or views contained in this report, or for any loss or damage suffered.