China: The Horse Has Been Brought to Water, But Will It Drink?
Andrew Hencic, Senior Economist | 416-944-5307
- Category:
- Global
- Asia
- Global Economics
Highlights
- Our baseline view is that the economy will expand by 5% in 2023 and just north of 4% in 2024. However, as bad news accumulates, we recognize the growing downside risks to this forecast.
- Soft consumer inflation figures and a sagging GDP deflator suggest the economy is already operating with excess capacity. How consumer and business sentiment responds in the months ahead will be a critical determinant of whether the economy steadies itself or whether a weaker scenario plays out.
- A healthy rebound in consumer spending, borrowing, and business sentiment are going to be markers of a sustained turnaround.
The mood surrounding the outlook for China’s economy has soured of late. Our baseline view (link) is that the economy will expand by 5% in 2023 and just north of 4% in 2024. However, as bad news accumulates, we recognize the growing downside risks to this forecast. Among the many implications for global markets, the prospects of a period of drawn-out deflationary weakness would weigh on the global commodities outlook, and spell trouble for exporters reliant on a country that absorbed roughly 12% of global goods imports in 2021 – worth roughly US$2.6 trillion.
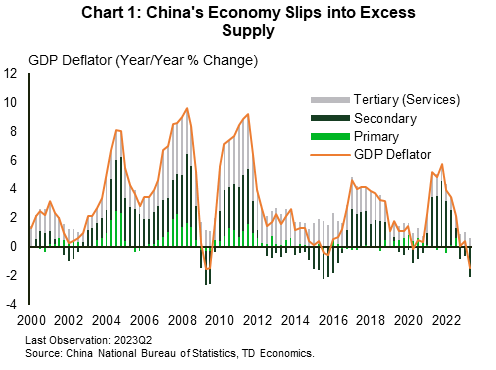
As authorities mobilize measures to support employment and the economy, and state banks reportedly cut consumer lending and deposit rates to lift spending, the risk is that it’s all coming too late. Soft consumer inflation figures and a sagging GDP deflator suggest the economy is already operating with excess capacity (Chart 1). If consumers and businesses don’t take up what’s on offer, the risks of a prolonged underperformance builds.
A Modern Liquidity Trap
There are two interconnected forces at work that represent the largest risks to the medium-term outlook for the economy – a liquidity trap and a deflationary spiral. The former represents a situation where households and businesses prefer to hold cash balances rather than invest, even with rock-bottom interest rates. Downbeat expectations for economic prospects are commonly cited as a driving force behind this phenomenon. The latter represents an additional wrinkle when monetary policy has failed to support inflation and prices begin to fall, leading consumers and businesses to delay purchases in the hopes of benefitting from cheaper products in the future – creating a self-reinforcing loop. The most famous example is Japan’s “Lost Decade”, where highly expansionary policy rates were insufficient to stimulate demand amid deflation and a decade of little-to-no growth followed. Moreover, amid falling asset prices households and businesses paid down debts to repair balance sheets, weighing on growth.
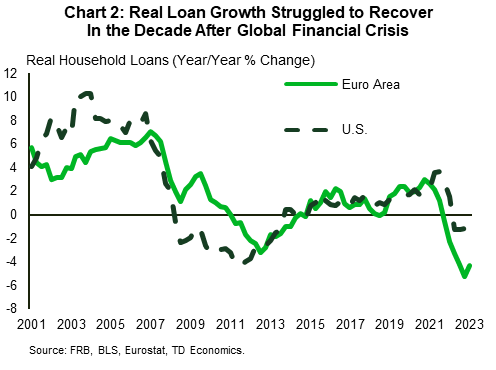
The shift to repairing balance sheets and a hesitancy to new investment is typically reflected in an extended period of weak loan growth (for both households and businesses). In the U.S. and euro area, real household loan balances contracted for years after the Global Financial Crisis before settling on a much weaker pace of growth (Chart 2).
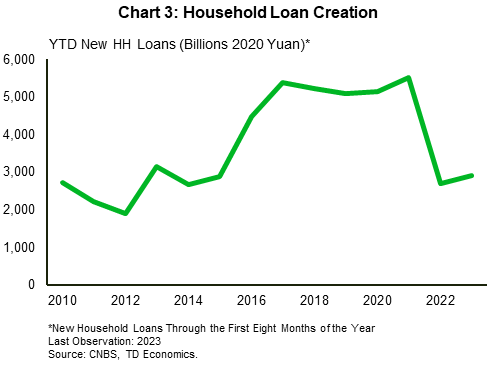
In China, the slowdown in the demand for loans has been notable. New borrowing by households has ticked up relative to 2022, but it remains less than half of its pre-pandemic pace of loan creation (Chart 3).
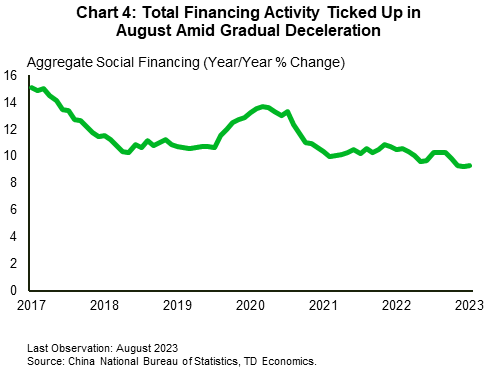
A broader measure of financial activity is Total Social Financing, which encompasses all financial flows (beyond just bank loans) heading to the real economy. So, while businesses have picked up some of the slack from households for bank loans, the overall pace of financing is still running at its slowest rate in years (Chart 4).
Readers would rightfully point out that key policy rates in China are not yet at the zero percent level synonymous with a liquidity trap – the one-year loan prime rate is at 3.45%, and the five-year rate at 4.2%. However, policymakers can’t necessarily gauge sentiment in real-time and actual policy rates can respond with a delay. For instance, in Japan, authorities cut the Basic Loan Rate from 6.0% in June 1991 to 0.5% in October 1995. The upper limit on the U.S. fed funds rate didn’t hit 25 basis points until December 2008 – nearly two years after the Fed started cutting rates in summer 2007.
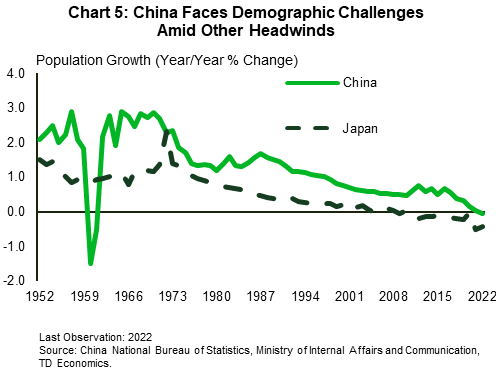
Demographic Drag Complicates Outlook
The comparison with Japan is particularly worrisome, as China’s population is estimated to have already started contracting – something that didn’t begin in Japan until the early 2000s (Chart 5). Shrinking populations weigh on growth, meaning the economy will need per-worker output to steadily rise just to offset the deleterious effects of a shrinking pool of available workers.
Moreover, although China’s economy is expected to continue developing, raising per person incomes, the mechanism behind it will become increasingly complex. Traditionally in emerging markets with expanding populations, capital accumulation helps facilitate rising output per worker. However, China’s workforce is expected to begin shrinking soon, meaning that capital per worker will rise due to weakening demographic forces – thereby necessitating less investment than in the past.
What will be crucial is the extent to which investment in more advanced technologies will allow per-worker productivity to continue to grow and offset the demographic drag. Authorities for their part have placed an emphasis on growing advanced industries to safeguard a leading position in the global manufacturing chain.
What We’re Looking For
As the economy struggles to gain traction and growth in advanced economies slows, how consumer and business sentiment responds in the months ahead will be a critical determinant of whether or not the economy steadies itself. Put another way, a recovery in sentiment would be important in rebuilding the demand for credit and avoiding any pitfalls.
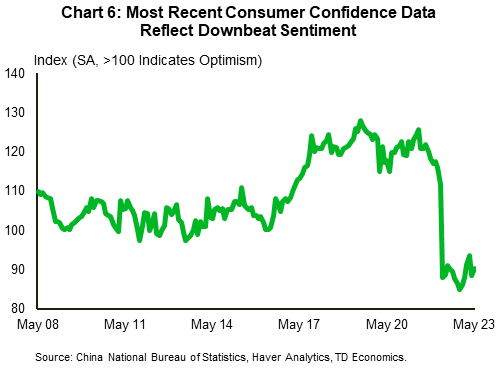
From the consumer perspective, the confidence barometer comes with a lag, but shows a lack of recovery in sentiment since last April’s strict lockdowns (Chart 6). However, timely retail sales data provide insights into consumers’ penchant for spending. On this front, August contained a modicum of good news, as sales posted a slight recovery, + 4.6% y/y, after a disappointing result in July. Moreover, with goods prices still in decline in the month (-0.7% y/y), volumes turned in a stronger performance. Still, only time will tell if this is a one-off, while the underlying pace continues to meaningfully lag the expected trend growth rate.
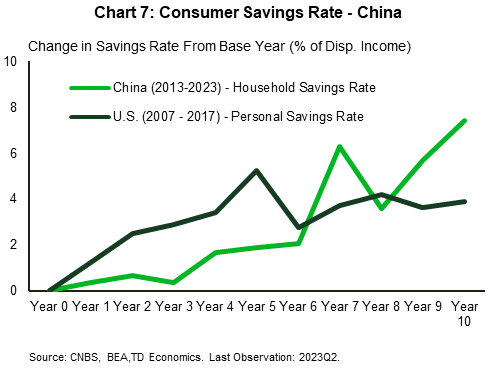
While monthly retail expenditures provide a timely measure of consumer outlays, what is important is identifying changes in the spend/save decisions of households. Retail sales provide intermittent guideposts of behavior, but the quarterly household savings rate serves as the barometer for precautionary savings. Here, the household savings rate has been creeping higher for years and has risen roughly five percentage points since the pre-pandemic period (Chart 7). For reference, the U.S. personal savings rate rose a similar amount between 2007 and 2012 in the aftermath of the Global Financial Crisis. With the reported cut to domestic deposit and lending rates , authorities are hoping to reverse this trend.
While the choices households make are important for the outlook, they still make up a relatively small portion (37%) of GDP. In contrast, consumption expenditures represented nearly half of Japan’s GDP in 1991 and over two-thirds in the U.S. prior to the GFC. Authorities are looking to rely on consumer led growth in the future but for the time being, investment (still over 40% of GDP) remains key to making the economy go. Healthy business sentiment is needed to support the investment growth required to help raise living standards.
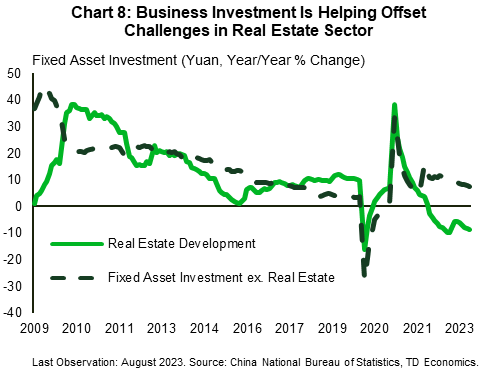
On this front, there are also worrying developments. Investment growth is slowing – through the first seven months of the year, total fixed asset investment is just 3.4% higher than in 2022 (in nominal terms), compared to growth of over 5% in 2018 and 2019. The malaise in the real estate sector is especially pronounced, as investment in real estate fixed assets has contracted 8.5% year-to-date y/y, compared to an expansion of 7.8% in the rest of the economy (Chart 8).
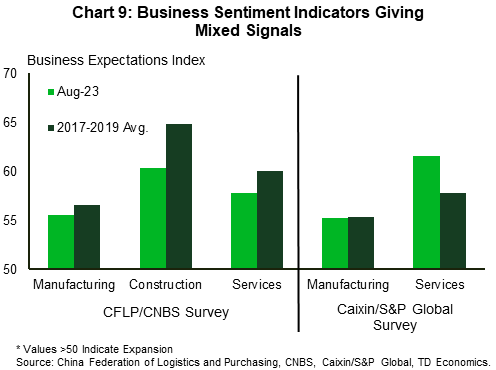
The healthy increases in investment outside of real estate is a silver lining. However, other datapoints suggest that this growth may not be sustained. Private sector fixed asset investment flows are down 0.7% relative to the first eight months of last year. A worrying sign to be sure, but business sentiment indicators are not as downbeat as one might expect. Official Purchasing Managers’ Index (PMI) data show deteriorating expectations in the construction and services sectors (Chart 9) being partially offset by improvements on the manufacturing front. Conversely, private sector PMI indicators show expectations in the services sector to still be substantially higher than the pre-pandemic norm, while the manufacuting sector is struggling to gain traction. The seemingly offsetting sentiment indicators reflect an economy that is still trying to find its footing as it works through pockets of vulnerability.
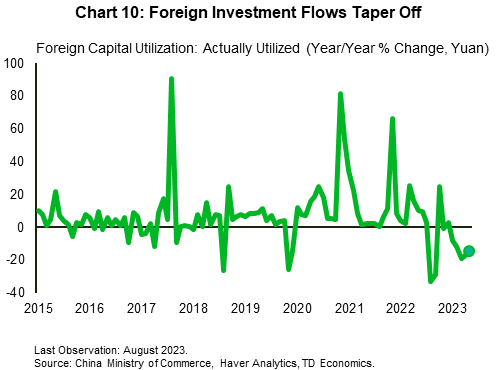
Conversely, international businesses appear to be feeling downbeat about prospects as foreign direct investment flows year-to-date are 9% lower than last year – a print that masks even greater recent weakness due to a healthy uptick in January 2023 (Chart 10).
Reports of local governments pulling forward borrowing (now expected to hit their annual quota of special purpose bond issuance by September) and being offered a lifeline to restructure some problematic debts, should support public infrastructure spending in the coming months. No doubt there will be a lift to economic activity from the increased outlays, but the main issue is whether increased activity will restore confidence in the private sector.
Policy Response Proceeds in Piecemeal Fashion
A strong policy response (fiscal and monetary) is typically needed to keep spirits up in the private sector and prevent the economy from slipping into a prolonged malaise. For their part, authorities in China have unveiled a plethora of initiatives. These include extending the temporary tax cut for smaller businesses through 2027, cutting the stamp tax on securities transactions, encouraging longer operating hours in the services sector, helping local governments restructure their liabilities, and restarting the moribund housing market through rule changes and reportedly cutting rates for borrowers. Ultimately, what will judge the success of the policy measures is whether they serve to support growth enough to shift consumer preferences away from precautionary savings and towards spending.
Moreover, it seems unlikely that authorities are willing to unveil a stimulus on the scale of the gargantuan program in 2008. The 4 trillion-yuan stimulus initiative represented roughly 12.5% of 2008 GDP and would equate to roughly 15 trillion yuan today – or about $2.2 trillion USD.
That said, there is always a chance more could be on the way. Authorities recently announced plans to assist a large shadow bank that has run into financial trouble. Recent reports also suggest the prospect of easing limits on foreign investment to attract more international capital. Lastly, should conditions continue to deteriorate, authorities could be moved to act more forcefully.
Implications for the Global Outlook
For global markets, China slipping into a liquidity trap would results in a prolonged period of below-trend growth in the country – a firmly disinflationary force. First and foremost, commodities prices will be affected by shifts in demand. China currently consumes roughly 15 million barrels per day (bpd) representing roughly 16% of global oil production, whereby a downshift in demand would partially offset the temporary supply cuts implemented Saudi Arabia and others. Apart from oil, decreased industrial activity would weigh on demand for coal and natural gas, and key industrial metals (copper and steel) used in construction. The silver lining for advanced economies still working to bring down inflation is that any drag from the commodity channel will help to moderate further cost-push inflation.
Moreover, a protracted period of below trend growth would exacerbate the lack of pricing power we’re witnessing. For advanced economies that have been focusing on diversifying supply chains, there are still ample linkages with Chinese producers. This means that although any disinflationary impulses may not be as large as they have been in the past (link), growing economic capacity in China should still translate into softer price growth – if not outright falling prices – for exported goods.
The unfortunate flip side is that China is the destination for roughly $2.7 trillion of goods and $440 billion of services exports, leaving both advanced and emerging market economies exposed to declining demand. For Canada and the U.S., direct trade exposures are relatively small at 1.3% and 1.0% of 2021 GDP, respectively. Other majors, particularly in Asia have much closer direct trade relationships.
However, direct trade figures understate the total economic relationship. The most recent (2020) data show that revenues of multinational affiliates operating in China showcase the extent of the relationship. Sales of multinationals in China were equivalent to another 0.6% of Canadian and 2.5% of U.S. GDP. However, when the economies of five of China’s major trading partners (South Korea, Australia, Japan, Germany, and Brazil) are included, the figures swell to 4.8% and 7.5% of GDP for Canada and the U.S., respectively. A substantially higher figure.
Lastly, downbeat expectations of economic activity in China and a disinflationary impulse would work to take some pressure off advanced economy bond yields. Moreover, should other global downside risks manifest themselves simultaneously, the prospect of a flight to safety could exacerbate the move and add upside pressure to the U.S. dollar.
Bottom Line
Ultimately, economics is more art than science, and never more so than when staring down a deflationary spiral and potential liquidity trap that are wholly dependent on the collective decisions of a populace. Right now, the restoration of consumer and business confidence will be the determining factor for how the coming months – and potentially years – play out. A healthy rebound in consumer spending, borrowing, and business sentiment are going to be markers of a sustained turnaround. China’s policymakers have brought the proverbial horse to the water, now we just have to sit back and see if it’ll drink.
End Notes
- State Council of The People’s Republic of China, (May 2015) “’Made in China 2025’ Plan Issued”: http://english.www.gov.cn/policies/latest_releases/2015/05/19/content_281475110703534.htm
- Bloomberg News (Aug. 29, 2023) “China Banks to Cut Mortgage, Deposit Rates in Stimulus Bid”: https://www.bloomberg.com/news/articles/2023-08-29/china-to-cut-rates-on-existing-mortgages-as-soon-as-today
- Bloomberg News (Aug. 1, 2023) “China Puts Pressure on Local Governments in Pro-Growth Push”: https://www.bloomberg.com/news/articles/2023-08-02/china-moves-to-roll-out-pro-growth-policies-as-economy-struggles
- Reuters (Aug. 20, 2023) “China Vows to Coordinate Support to Resolve Local Government Debt Risks”: https://www.reuters.com/world/asia-pacific/china-vows-coordinate-support-resolve-local-government-debt-risks-2023-08-20/
- Bloomberg News (Aug. 29, 2023) “China Banks to Cut Mortgage, Deposit Rates in Stimulus Bid”: https://www.bloomberg.com/news/articles/2023-08-29/china-to-cut-rates-on-existing-mortgages-as-soon-as-today
- Bloomberg News (Aug. 30, 2023) “China Moves to Stabilize Finances of Troubled Shadow Bank”: https://www.bloomberg.com/news/articles/2023-08-30/china-asks-citic-to-examine-finances-of-shadow-bank-zhongrong?srnd=premium-canada
- World Bank - World Integrated Trade Solution: https://wits.worldbank.org/CountryProfile/en/Country/CHN/Year/2021
- Canadian data only include majority owned affiliates. U.S. data represent all affiliates.
Disclaimer
This report is provided by TD Economics. It is for informational and educational purposes only as of the date of writing, and may not be appropriate for other purposes. The views and opinions expressed may change at any time based on market or other conditions and may not come to pass. This material is not intended to be relied upon as investment advice or recommendations, does not constitute a solicitation to buy or sell securities and should not be considered specific legal, investment or tax advice. The report does not provide material information about the business and affairs of TD Bank Group and the members of TD Economics are not spokespersons for TD Bank Group with respect to its business and affairs. The information contained in this report has been drawn from sources believed to be reliable, but is not guaranteed to be accurate or complete. This report contains economic analysis and views, including about future economic and financial markets performance. These are based on certain assumptions and other factors, and are subject to inherent risks and uncertainties. The actual outcome may be materially different. The Toronto-Dominion Bank and its affiliates and related entities that comprise the TD Bank Group are not liable for any errors or omissions in the information, analysis or views contained in this report, or for any loss or damage suffered.
Download
Share: