Highlights
- The tariffs that remain in place on U.S. imports from China are going to be a headwind for China this year.
- For China, tariffs are what economists would call a demand shock, and the response is fairly simple – authorities can address the fallout from tariffs by putting in place measures to boost demand.
- If fiscal authorities in China are reluctant to expand government borrowing to fully offset the hit from tariffs, China’s economy will see reduced inflation pressures. Given China’s size and importance in global supply chains, this disinflation is likely to weigh on inflation globally.
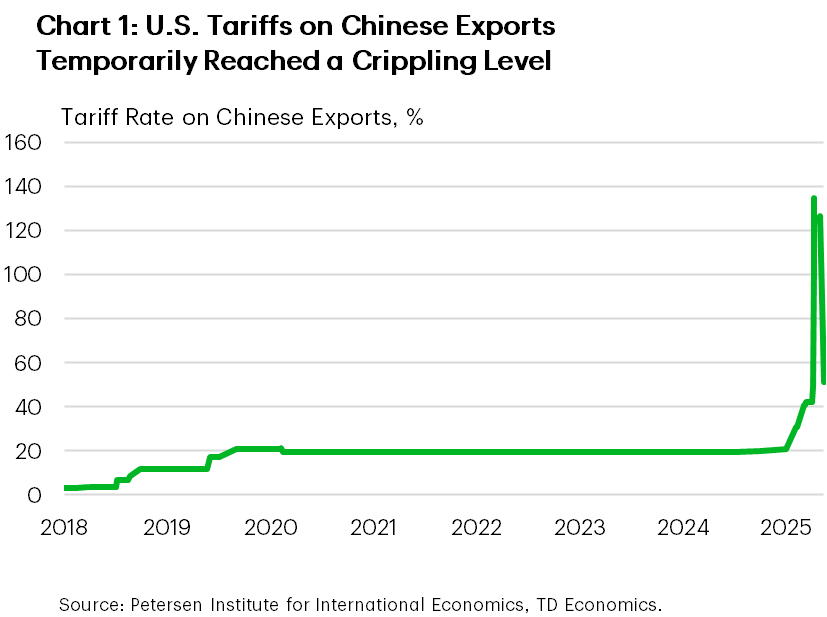
The tariff truce between the U.S. and China announced on May 12th was much needed. This was not the first time the U.S. had ratcheted up tariffs on imports from China, but the level reached in April was unprecedented and very nearly amounted to a trade embargo. Under the previous Trump administration, tariffs on China were gradually increased to an effective rate of around 20%1 by the end of his first term. At the time, the level was perceived as both large and a significant unwinding of the interlinked global supply chains that had evolved over the prior 30 years. But that rate pales in comparison to the 145% temporarily in effect in April 2025 (Chart 1) and the current effective 50% rate in place.
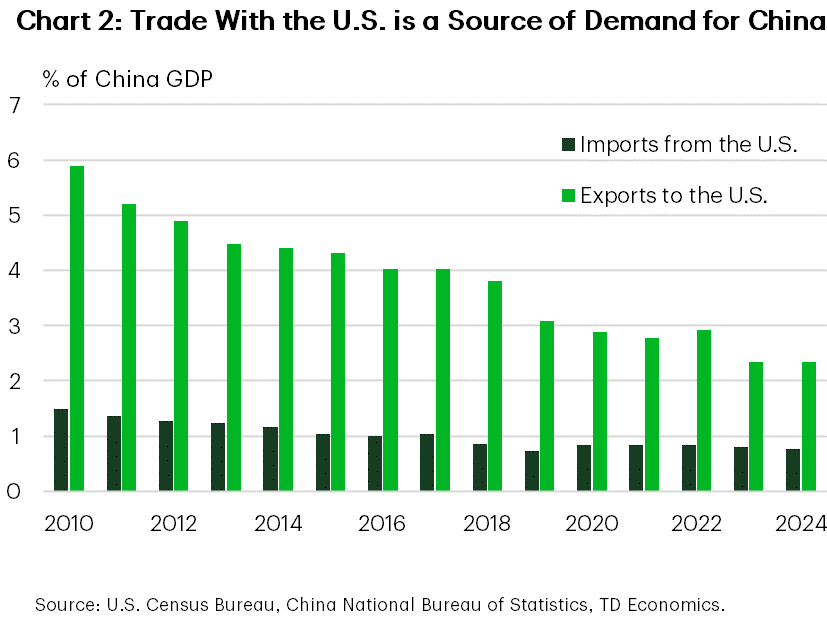
China has retaliated with broad tariffs of roughly 30% on all U.S. goods. Retaliatory tariffs are inflationary, because they raise the cost of imported goods, and act as a drag on productivity, by disrupting established supply chains. For China, which has much more in exports to the U.S. than it does in imports (Chart 2), the higher-tariff environment amounts a negative demand shock. In theory, the economic weakness could be offset by traditional responses to an economic downturn such as fiscal or monetary policy.
China Still Has Excess Capacity
Overall growth in China has been slower in the post-pandemic period. Prior to 2020 growth was largely fueled by investment, including a boom in China’s now-troubled property sector. These issues came to a head in 2023, when the housing market meltdown, coupled with the after-effects of COVID-era lockdowns, hit consumer confidence. Economic activity most closely linked to household spending bore the brunt of the sentiment shift and began growing much more slowly.
Weaker activity in the household sector compounded the long-running issue in China’s economy – the overreliance on investment-led growth. Policymakers have long contemplated a so-called “rotation” of Chinese demand from investment to consumption, but it has yet to come to fruition. The most recent setback leaves it, in some respects, further away than ever as China contends with managing the deleveraging of its property sector and the ensuing declines in asset values.
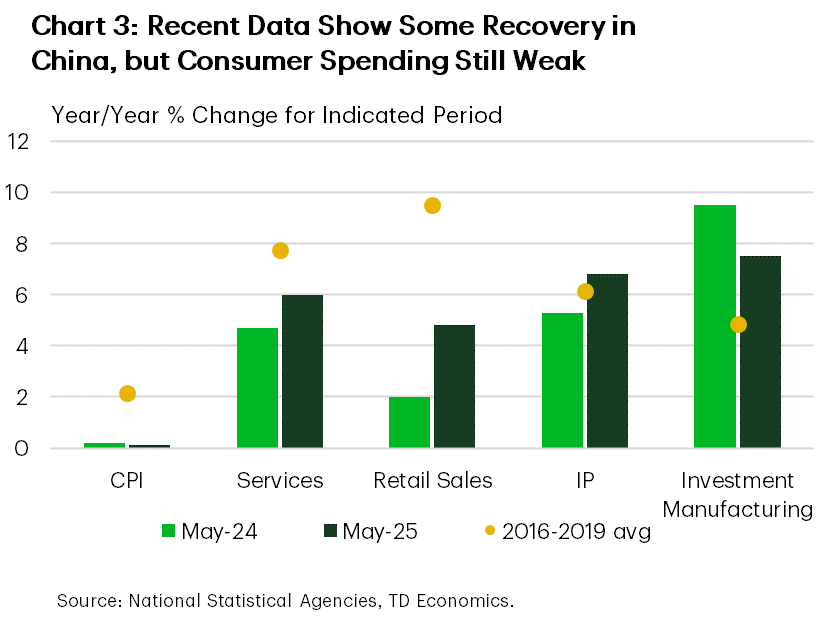
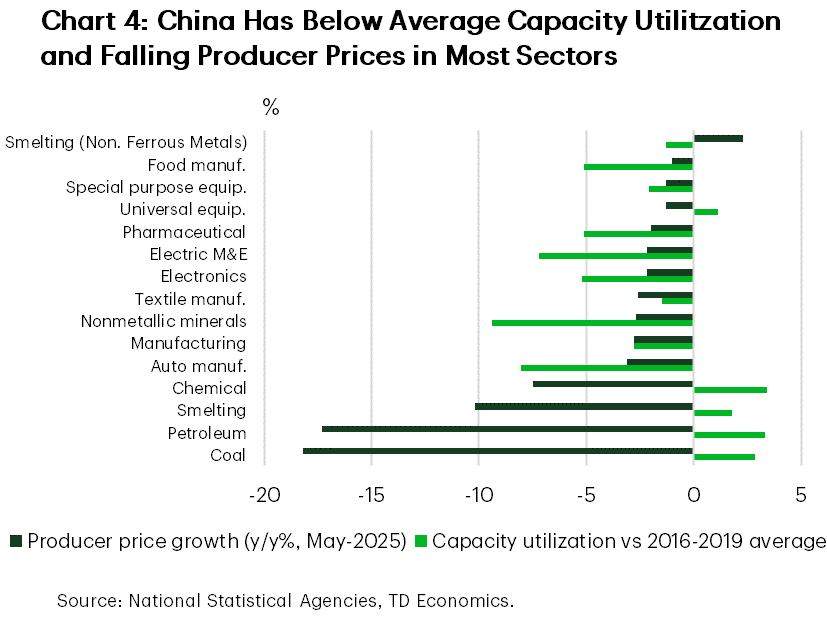
Recent data show China’s economy still has a long way to go (Chart 3). Inflation is still close to zero and while retail sales have picked up compared to a year ago, it is being powered by government subsidies. In comparison, industrial production and manufacturing investment are now growing at or above trend, having maintained this pace of growth through the consumer-led downturn. The continuation of investment-led growth is reflected in the low levels of capacity utilization across China’s industrial sectors and widespread deflation in producer prices in most industries (Chart 4).
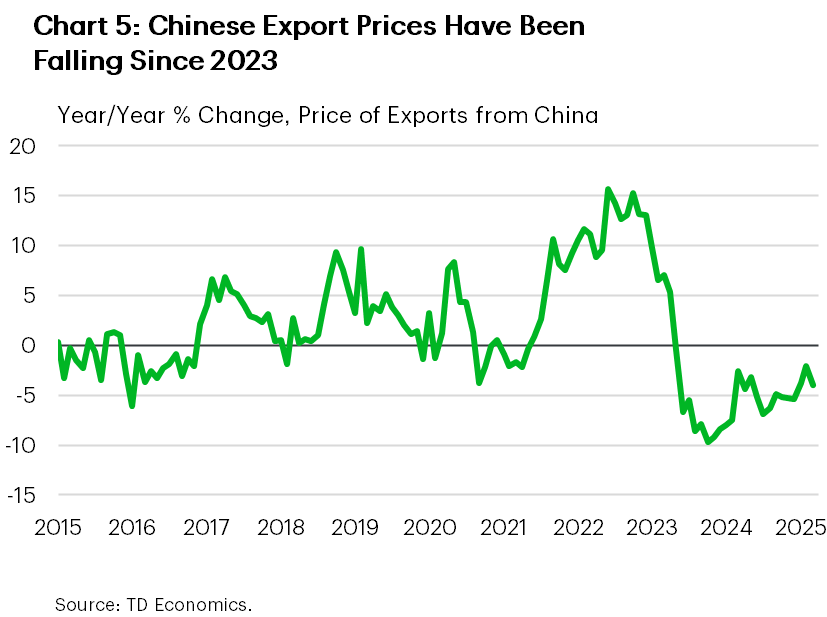
The deflation in China’s domestic economy is emanating to the rest of the world. Since mid-2023, export prices in China have been falling at a rate that is notably faster than in prior episodes (Chart 5). Moreover, the economy continues to rely on external demand amid a weak domestic backdrop. This means firms unable to afford losing out on valuable access to the U.S. are investing in additional factories in third countries (still closely linked to China’s supply chains) or using outright transshipment to avoid punitive tariffs.
The medium-term impacts to the global economy of these tactics are ambiguous. Investing in another location likely undermines some of the productivity advantage from producing in China, as does transshipping through a third country. The limits of these strategies may already be starting to come through as outward foreign direct investment from China grew 3.5% year-on-year (on a year-to-date basis) in March 2025, down from 12.5% in March 2024. Whether this is a pause to see where trade barriers will ultimately land, or a more permanent development remains to be seen.
Limited Progress on Policies to Boost Demand
Policymakers in China are contending with a short-run problem – what to do in response to today’s tariffs – and a long-run problem – how to rebalance their economy to rely less on debt-fueled investment-led growth fueled by leverage. The antidote to both would be policies to directly support household demand by increasing consumer confidence and allowing consumer spending to become a driver of growth. So far, the measures announced this year are not geared toward this goal.
Most measures put forward before the U.S.-China trade truce announced on May 12 only support demand indirectly. The PBoC lowered its reverse repo rate and reduced mortgage costs, which does ease costs for borrowers – but credit demand remains weak, so it is not clear that reducing borrowing costs is the right policy lever to increase spending. Moreover, in the latest data, the household savings rate in 2023 was 34%, up from 31% in 2005. The rate had fallen from 38% in 2022, but authorities could pursue measures to make households more willing to spend their savings, and save at a lower rate, to raise consumption.
Authorities have also increased quotas for state and local government bond issuance, and in the past spending by state and local governments has fueled growth. But, once again, the challenge is that this might be tapping a well that has run dry. State and local governments are constrained not just by their bond quotas but by their existing debt burdens, and limited revenue tools.
An Inflation Offset for Canada
We don’t foresee a rapid turnaround in China’s economy. This means the ongoing price wars are likely to continue reverberating through the manufacturing sector, and challenge policymakers’ toolkits on how to respond. However, for global consumers they continue to provide a temporary salve against higher inflation.
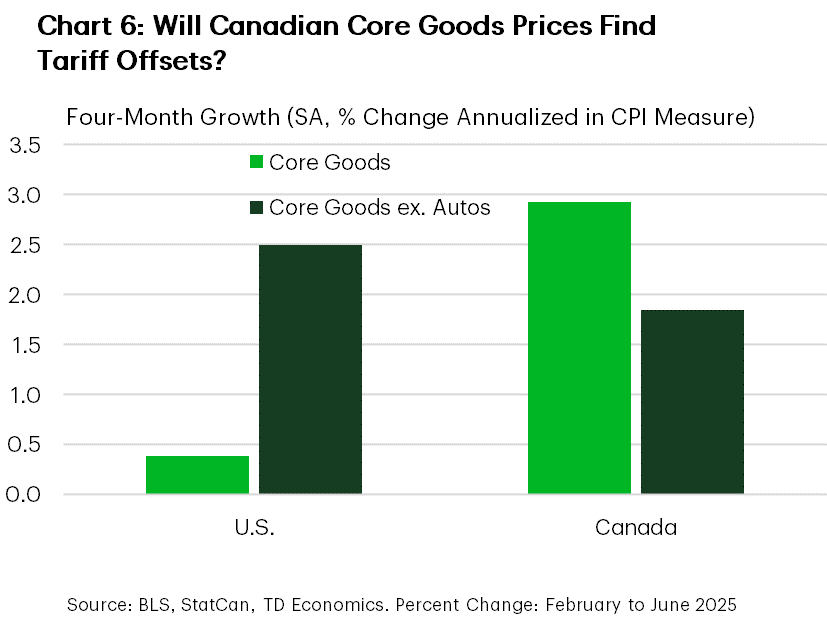
As we have written before, due to its size and crucial role in global supply chains, consistently increasing Chinese capacity acts as a mechanism to cool global price growth. In Canada, a country that, apart from electric vehicles, has not substantially increased tariffs on China, we would expect the price growth of core goods to be relatively tempered. Canada’s high degree of economic reliance on the U.S. makes it unlikely consumer will emerge unscathed from knock-on effects of U.S. tariffs on China. However, inflation in core goods (ex-autos) has been slightly milder (Chart 6) since tariffs were first introduced in March.
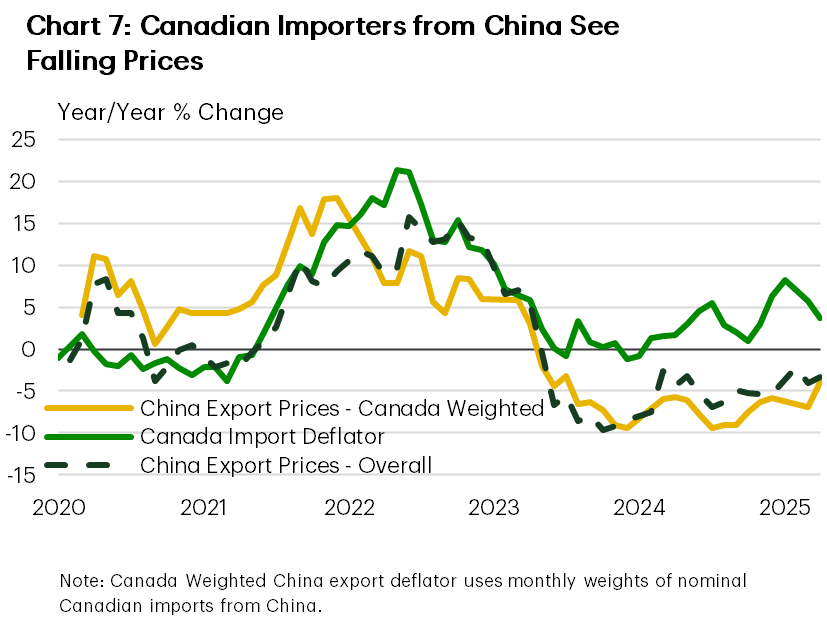
Our work suggests that the ongoing excess capacity in China will continue to provide some offset to these inflationary pressures (Chart 7). However, there is upside risk, and the course of the trade war is paramount. There are early signs that China’s property market correction is reaching its nadir and may begin to turn. This is one of the prerequisites for China to pull out of deflation. If the worst of the trade tensions with the United States can be resolved, the excess capacity that has formed will be gradually absorbed, eroding the disinflationary relief other advanced economies have benefitted from. In this case, more rapid economic growth could boost inflation both through directly higher product prices, and the broader lift to energy prices and indirect costs. In this scenario, an upside risk would be a lift of one percentage point (over the course of a year) to Canadian producer prices, and a smaller 20 basis point lift to both headline and core CPI.
End Notes
- Measured as customs duties collected as a percentage of total dutiable value imported from China. As a ratio total imports the effective rate was closer to 10%.
Disclaimer
This report is provided by TD Economics. It is for informational and educational purposes only as of the date of writing, and may not be appropriate for other purposes. The views and opinions expressed may change at any time based on market or other conditions and may not come to pass. This material is not intended to be relied upon as investment advice or recommendations, does not constitute a solicitation to buy or sell securities and should not be considered specific legal, investment or tax advice. The report does not provide material information about the business and affairs of TD Bank Group and the members of TD Economics are not spokespersons for TD Bank Group with respect to its business and affairs. The information contained in this report has been drawn from sources believed to be reliable, but is not guaranteed to be accurate or complete. This report contains economic analysis and views, including about future economic and financial markets performance. These are based on certain assumptions and other factors, and are subject to inherent risks and uncertainties. The actual outcome may be materially different. The Toronto-Dominion Bank and its affiliates and related entities that comprise the TD Bank Group are not liable for any errors or omissions in the information, analysis or views contained in this report, or for any loss or damage suffered.
Download
Share: