Outlook for Emerging Markets Dims as Geopolitical Events Weigh Heavily
Andrew Hencic, Senior Economist | 416-944-5307
Date Published: July 4, 2022
- Category:
- Global
Highlights
- The coming year will certainly pose economic challenges for emerging markets (EM), but there is still ample slack to be made up after the past two pandemic years that will support growth for many countries.
- Three shocks are the main drivers of the lower outlook for EMs: the spring lockdowns in China, the war in Ukraine, and the sanctions on the Russian economy.
- A strong rebound in services spending and a well-executed soft landing in advanced economies can help countries avoid the perils of a rapid tightening of financial conditions.
Skyrocketing food prices and interest rate hikes in advanced economies have brought back bad memories of past stumbling blocks for emerging market (EM) economies. Yet, EMs are not a homogenous group, and while the coming year will certainly pose economic challenges, there is still ample slack to be made up after the past two pandemic years that will provide a fillip to growth for many countries.
We have highlighted the risks to the outlook in our recent Quarterly Economic Forecast and Question and Answer publications. Broadly speaking, tighter financial conditions, slowing growth in advanced economies, the knock-on effects from the war in Ukraine, and China's commitment to Zero-COVID will all weigh on demand. Our outlook for emerging markets has been marked down to 3.2% in 2022 (from over 4% in our March outlook).
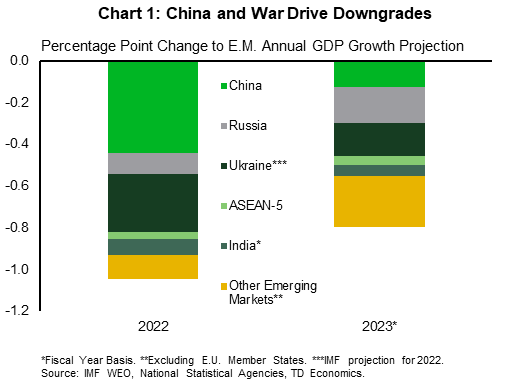
Three shocks are the main drivers of the lower outlook for EMs: the spring lockdowns in China, the war in Ukraine, and the sanctions on the Russian economy (Chart 1). Beyond that, the global economic landscape is shifting as growth in advanced economies slows – with anticipated knock-on effects for the rest of the world.
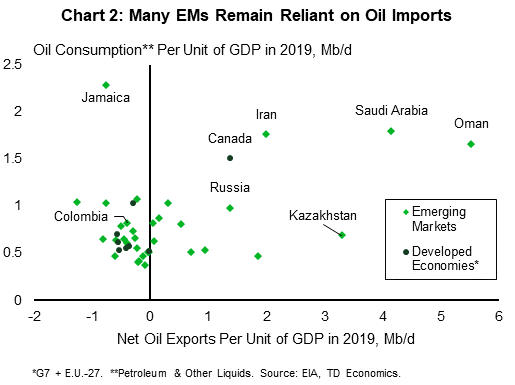
The war in Ukraine has kicked off another surge higher in energy prices. For most of the world that imports oil, gas, and other refined products, higher energy prices act as a tax on households, eroding disposable incomes. Europe and its reliance on Russian energy products is taking headlines, but many other nations are reliant on overseas imports of energy that keep their economies running (Chart 2). Rising prices of key commodities (accompanied by the recent surge in the U.S. dollar) materially raise input costs for firms in import reliant markets.
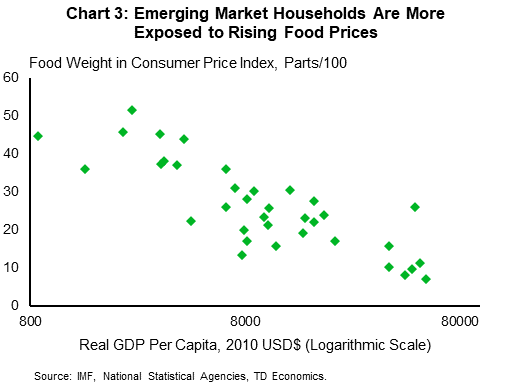
Moreover, food prices have risen sharply since last year. This is, in part, due to Ukrainian supplies of staple foods being unable to get to market, resulting in materially disruptions to global supplies. Other producers have imposed export restrictions in order to limit domestic price increases, exacerbating the problem. Importantly, food expenditures make up a much larger share of the household expenditure basket in less developed nations than in advanced economies. One way to visualize this is to just examine the weight food and beverages have in the consumer price index basket (Chart 3). Higher food prices will be reflected in more severe inflation, that indicates a rapid erosion in living standards and leaves less money available to purchase other goods and services.
Of course, what is a bust for some will be a boon for others. Petroleum exporters with relatively low marginal costs are going to receive a windfall from the suddenly higher prices for their product. However, ongoing challenges scaling up production among some OPEC members means the windfalls won't be as great as they could have been. Moreover, as demand prospects weaken, prices should soften through the back half of the year.
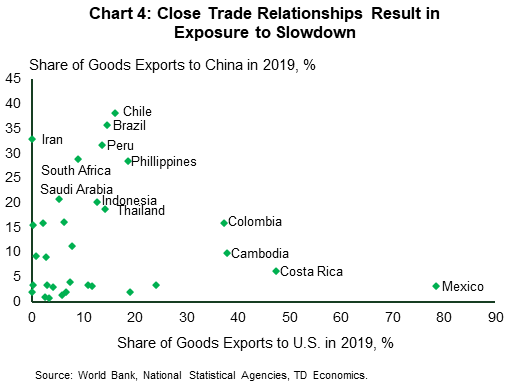
Apart from knock-on impacts from higher commodity prices, the increasingly downbeat outlook for China and the U.S. will bleed into total global demand. China and the U.S. accounted for 13.9% and 8.5% of global merchandise imports in 2019 and any slowdown in activity will trickle down through supply chains. Some respite can be expected as depleted inventories are rebuilt, but exposed economies (Chart 4) should still expect a more muted growth outlook through the balance of the year.
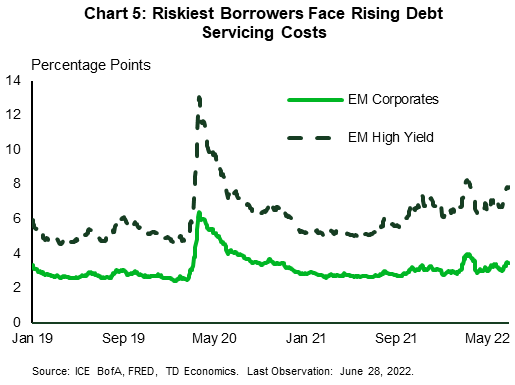
Prospects for softer demand are weighting on revenue and profitability outlooks. As central banks in advanced economies raise borrowing rates financial conditions are tightening, with more profound effects in riskier segments of the market. As the risk-off mood has broadened, emerging market equities have sold off, while spreads on EM high yield bonds have risen roughly 280 basis points since 2021. As higher costs of capital feed through to the economy the challenging conditions will leave vulnerable firms looking to secure liquidity.
Tail risks are also ever present. To combat domestic inflation and stave off capital flight many emerging market central banks began aggressively raising interest rates in 2021 – and continue to do so. The issue is that much like advanced economies, emerging markets borrowed heavily to combat the effects of the pandemic over the past two years – taking public debt-to-GDP ratios roughly 10 percentage points higher (Chart 6). Moreover, much of the issuance that took place was purchased by domestic financial companies, a phenomenon the IMF referred to as the sovereign-bank nexus in its April Financial Stability Report . Credit events, and funding constraints, then risk being amplified through domestic financial markets stifling liquidity and exacerbating any downturns. That said, despite the risk domestic debt presents, this sequence of events is not embedded in the baseline forecast, but rather is a risk that needs to be monitored.

Ultimately, as global growth is moved into a lower gear by slowing heavyweights (China, U.S., European Union), medium-term growth prospects become increasingly fraught. Abruptly slower growth expectations increase the chance of economic missteps, helping drive risk spreads higher. Even without the economy hitting a tipping point, the more challenging credit environment will restrain investment and lending.
The upside risk is the resilience and revival of the services sector. The prime example is tourism. Thailand, for instance, saw tourist arrivals plummet from nearly four million in December 2019 to 520 thousand in May 2022. In 2019 this sector represented 6.8% of Thailand's GDP but had fallen to 3.8% in 2021. The pace of reopening to foreign visitors varies across countries, but as reopening gains steam, there is plenty of slack to be made up.
Bottom Line
The landscape for emerging markets has grown increasingly challenging in 2022. As the pandemic continues to circulate, supply shocks stemming from the war drove up the cost of living, and growth in key developed markets slows, the pace of recovery is set to wane. That said, with ample economic slack remaining after the pandemic shock, there is still room to grow and if advanced economies managed to execute a soft landing, helping EMs avoid the risks associated with a rapid tightening of financial conditions.
Appendix
Countries included in each chart:
- Chart 2. Argentina, Brazil, Chile, Colombia, Jamaica, Mexico, Peru, Trinidad and Tobago, Bosnia and Herzegovina, Bulgaria, Croatia, Kazakhstan, Kyrgyzstan, Russia, Serbia, Slovakia, Ukraine, Uzbekistan, China, Indonesia, Philippines, Sri Lanka, Thailand, Egypt, Ghana, Iran, Nigeria, Oman, south Africa, Tunisia, Turkey, Zambia, Saudi Arabia, Canada, France, Italy, U.S., EU-27, Germany, U.K., and Japan.
- Chart 3. Canada, U.S., E.U.-27, Germany, United Kingdom, Japan, Argentina, Brazil, Chile, Colombia, Costa Rica, Mexico, Peru, Bulgaria, Croatia, Latvia, Russia, Serbia, Slovakia, Ukraine, Cambodia, China, Hong Kong, India, Indonesia, Philippines, Sri Lanka, Thailand, Botswana, Egypt, Ghana, Kenya, Mauritius, Morocco, Nigeria, Oman, South Africa, Turkey, and Saudi Arabia.
- Chart 4. Canada, E.U.-27, Germany, United Kingdom, Japan, Argentina, Brazil, Chile, Colombia, Costa Rica, Mexico, Peru, Kazakhstan, Kyrgyzstan, Montenegro, North Macedonia, Ukraine, Uzbekistan, Cambodia, Indonesia, Philippines, Sri Lanka, Thailand, Egypt, Ghana, Iran, Kenya, Mauritius, Morocco, Nigeria, Rwanda, South Africa, Turkey and Saudi Arabia.
- Chart 6. EM states: Argentina, Brazil, Chile, Colombia, Costa Rica, Jamaica, Mexico, Peru, Trinidad and Tobago, Bosnia and Herzegovina, Kazakhstan, Kyrgyzstan, Montenegro, North Macedonia, Russia, Serbia, Ukraine, Uzbekistan, Cambodia, China, India, Indonesia, Philippines, Sri Lanka, Thailand, Botswana, Egypt, Ghana, Iran, Kenya, Mauritius, Morocco, Nigeria, Oman, Rwanda, South Africa, Tunisia, Turkey, Zambia, and Saudi Arabia.
End notes
- IMF (April 2022) " The Sovereign-Bank Nexus in Emerging Markets: A Risky Embrace" Global Financial Stability Report. Chapter 2.
Disclaimer
This report is provided by TD Economics. It is for informational and educational purposes only as of the date of writing, and may not be appropriate for other purposes. The views and opinions expressed may change at any time based on market or other conditions and may not come to pass. This material is not intended to be relied upon as investment advice or recommendations, does not constitute a solicitation to buy or sell securities and should not be considered specific legal, investment or tax advice. The report does not provide material information about the business and affairs of TD Bank Group and the members of TD Economics are not spokespersons for TD Bank Group with respect to its business and affairs. The information contained in this report has been drawn from sources believed to be reliable, but is not guaranteed to be accurate or complete. This report contains economic analysis and views, including about future economic and financial markets performance. These are based on certain assumptions and other factors, and are subject to inherent risks and uncertainties. The actual outcome may be materially different. The Toronto-Dominion Bank and its affiliates and related entities that comprise the TD Bank Group are not liable for any errors or omissions in the information, analysis or views contained in this report, or for any loss or damage suffered.
Download
Share: