Sweating the (Not So) Small Stuff
Andrew Hencic, Senior Economist
Date Published: November 18, 2021
- Category:
- Global
- Global Economics
Highlights
- Supply chain constraints and a surge in energy prices – coming at a time of large fiscal and monetary stimulus – have helped push consumer inflation to multi-decade-highs across advanced economies.
- As the global economy contends with the supply shock, a slowdown in China’s economic growth has further clouded the prospects for the recovery.
- We remain of the view that inflation rates will begin to head lower in the coming months as consumer spending in advanced economies rotates away from goods and back to services. In China, proactive measures to secure energy supplies are a reassuring sign that authorities are moving to alleviate production problems.
- However, there is a high degree of uncertainty around the outlook. As such, we have conducted a simulation study to gauge the potential economic impacts under a set of more pessimistic assumptions. Relative to our prevailing forecast, we calculate that U.S. and Canadian real GDP growth could come in lower by roughly 0.7 and 0.6 percentage points, respectively, in 2022.
Emerging from the pandemic, a series of supply side shocks have presented a growing challenge to economies around the globe. Surging inflation within advanced markets is a byproduct of the boost in demand from fiscal and monetary stimulus amid binding supply constraints. Prices are rising at their highest pace in many years in multiple regions: Eurozone (13-year high), U.S. (30-year high), U.K. (9-year high) and Canada (18-year high).
The sources of the stress have varied from semiconductor shortages to insufficient shipping containers and labor. Put another way, the plumbing underlying the global economy has effectively become clogged. Since the health crisis brought on shifts in consumption patterns, the common perception (that has been shared by us) is that the disruptions will gradually fade as activity reorients back to services under fewer business restrictions. It may take another six months or so, but time will heal this wound.
But what if that assumption turns out be wrong? What if these hiccups prove to be longer lasting?
In addition to the supply-chain disruptions, two other global risks that warrant special attention as 2021 draws to a close are: (i) elevated energy prices and shortages, exemplified by natural gas in Europe and coal in China; and (ii) the prospect of a dramatic deceleration of Chinese growth amid a crackdown on leverage in its property sector.
We have conducted a thought exercise that examines how medium-term growth performances among key economies could potentially be impacted under conditions that are moderately more pessimistic than those incorporated in our latest September baseline forecast. As we detail below, the simulations yield a real GDP growth hit of around 0.7 percentage points in the United States in 2022, whereas 0.6 percentage points would be shaved from Canadian growth over the same period.
Before delving into this alternative forecast scenario, we first provide some historical context around these key risks.
Ports, Power and a Pandemic Push On Prices
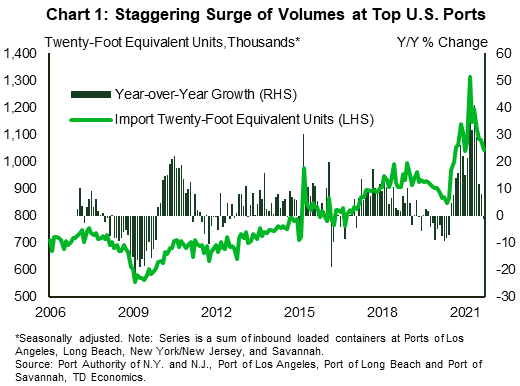
This story of supply side disturbances started after the first series of pandemic lockdowns stranded empty containers in parts of the world where they weren’t needed. When demand for goods surged as the economy reopened, prices to move goods skyrocketed.
The issue is most evident in the U.S. ports of Los Angeles, Long Beach, Savannah (Georgia), and New York-New Jersey. These are typically the four busiest U.S. ports. After troughing in May 2020 due to the combined effect of the pandemic and a trade war with China, shipping activity surged at an impressive pace (Chart 1).1 In the span of 10 months, inbound volumes rose 55%.
Indeed, shipping demand didn’t just normalize, it completely overshot. As of September, inbound activity was 16% above the average level in the two years prior to the crisis. Stories of a record number of ships at anchor off of California’s busiest ports have made headlines but unloading containers off the ships is only part of the story. Moving containers from the ports requires a logistical network, one that depends on the availability of rail capacity and truck drivers.
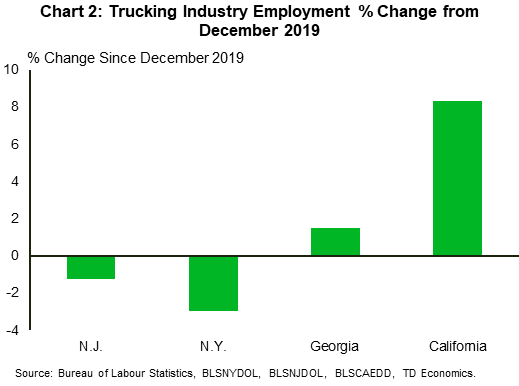
Here, too, there have been unprecedented bottlenecks. As container volumes exploded, so did the number of truck drivers in California (Chart 2). The gains, however, were more muted in the other states with large ports (Georgia, New York and New Jersey). As a result, there were far more containers than available drivers, leading to a pile up at these ports.
The bottlenecks have become so profound that Los Angeles has moved to start levying fines on carriers that don’t promptly move containers from the port area.2 As well intentioned as the fines might be, there is only so much that can be done if not enough people are working on the problem.
Of course, delivering goods is only part of the story. When factories ramped up to meet the demand for goods, energy requirements surged. In response, energy prices worldwide skyrocketed. In Europe, the effects are shaping up to be the most profound as a confluence of factors, some structural and some idiosyncratic, have collided to make a mess of natural gas markets.
Not surprisingly, the pandemic played a role in depressing energy supplies. Restrictions introduced last year to limit the spread of the virus resulted in the deferral of important maintenance at natural gas liquification facilities in Australia and Russia.3 These operations took place this year, leading to a decrease in global LNG supplies at a time that demand in Asia surged (more on this below). Compounding the issue, Norway also brought forward maintenance operations to the second quarter of the year, while Russian deliveries of piped gas to Europe fell as it restocked its own inventories.
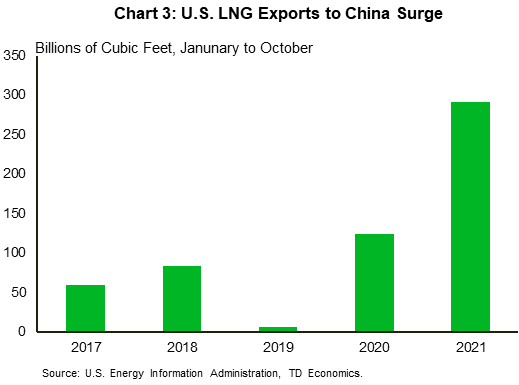
Demand-side surprises have also played a large role in pushing prices higher. Droughts in China and Brazil reduced hydroelectric output, requiring unexpected LNG deliveries. Healthy energy demand in China also increased demand for coal, which still accounts for over half of total energy consumption.4 However, limits on coal production, as authorities moved to rein in carbon dioxide emissions5, along with safety incidents and floods in coal producing regions, reduced its availability and drove up prices. This induced substitution, where possible, for natural gas. Moreover, even the increase in natural gas imports has not been enough to satiate energy demand, as authorities have contended with blackouts in the face of insufficient power supply.
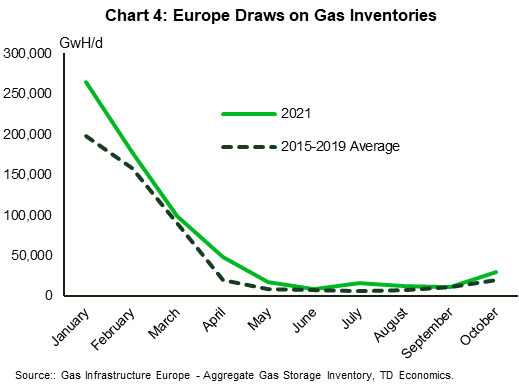
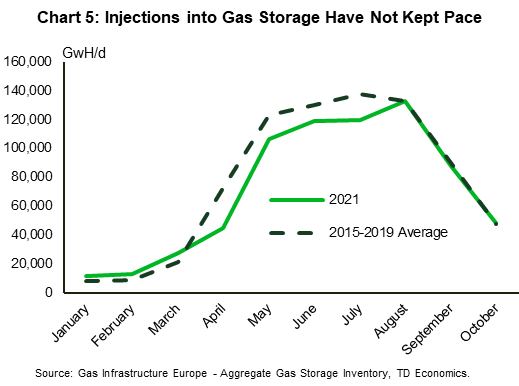
In Europe, a longer, and colder winter followed by a hot summer with limited wind generation meant gas supplies were tapped (Chart 4) to produce electricity at a time of the year when stockpiles are usually being filled (Chart 5). This exacerbated the large disconnect between supply and demand, leading to a surge in prices.
Currently, the pop in energy prices is contributing roughly half of the inflationary impulse in the Euro area. So, while supply chain factors are important (like component shortages due to pandemic related factory closures in emerging markets 6), the role of energy prices can’t be understated.
Further Deceleration in China is a Looming Risk
For the global outlook, China’s economic slowdown offers a key risk as it absorbs a series of shocks. In 2020, authorities moved to limit borrowing in the property development sector introducing a set of “Three Red Lines” that measure total leverage by firms. These regulations essentially set caps on liability-to-asset, debt-to-equity, and cash-to-short-term debt ratios - limiting the amount of borrowing firms can do to finance operations and acquisitions. For firms that were reliant on new debt to sustain the expansion and ongoing projects, the liquidity crunch has led to missed debt payments and delayed projects.7
The spillovers to the rest of the economy can be profound. Work by Rogoff and Yang (2020)8 put the total contribution of the real estate sector (both direct and indirect) at nearly 30% of GDP. Their estimates are even higher than those of Spain’s real estate sector, which made up roughly 26% of GDP before it melted down in epic fashion in 2008. As the economy rotates away from a reliance on real estate-powered growth, the concern is the extent to which alternative productive uses of capital can be readily found.
Further complicating matters is the threat of a drop in land and housing prices on government budgets. Local governments have historically relied on land sales for roughly a third of revenues9,10 while municipal governments used future land revenues as collateral for bank loans.11
Of course, a rapid depreciation in housing prices has other deleterious effects. Consumer confidence can wither as prospects for future housing price increases fade. Amplifying this effect is widespread balance sheet repair that depresses private consumption for a prolonged time.12 This factor is one of the key features of financial crisis-induced recessions, and the reason they tend to experience slower recoveries than those caused by other factors.
And lastly, we would be remiss not to mention the role COVID continues to play in the Chinese economy. The ongoing commitment to eradicating COVID within national borders is resulting in intermittent shutdowns and quarantines.13 Two high profile examples were the shutdown of a terminal at the Ningbo-Zhoushan port14 and the quarantine of roughly 30, 000 visitors at Disneyland Shanghai after a single reported case.15 While extreme examples, these situations are emblematic of the strict measures used to control the virus that continue to have a meaningful effect on the economy.
Where Things Likely Go from Here:
Faced with substantial global challenges, we anticipate many of these issues will resolve in the coming months. Indeed, there are already early glimpses of things turning a corner.
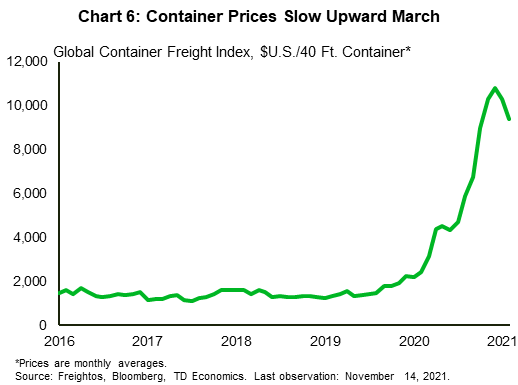
With regards to shipping containers, prices have unwound some of their gains as of mid-November (Chart 6). The cost of moving boxes is still extremely high, but no longer moving higher. The hold on shipping inflation comes as inbound container volumes at major U.S. ports slow. These are the types of early signals that are anticipated as consumer spending slowly rotates back to services and away from goods.

Globally, the recovery in services expenditures is progressing in fits and starts, with the emergence of the Delta variant being the most recent force to dent demand. OpenTable data show that while seated diners at restaurants are higher in Germany, the U.K. and Australia than they were in 2019, the U.S. and Canada remain below their 2019 levels (Chart 7). Yet the trend is towards improving conditions, despite temporary setbacks.
European natural gas prices have also eased from their record highs and, despite a recent rise, are roughly 15% below their October peaks. While more immediate relief is unlikely given the limited supplies available, higher prices typically presage increased supply (more details can be found in our recent commodity outlook). The winter may be a bumpy ride as electricity provider margins are squeezed (in the U.K. alone at least 16 providers have gone bankrupt16) but, at a minimum, 2022 likely won’t feature another wave of delayed maintenance on LNG facilities that reduces supply at a time when demand surges. There is also a political aspect to all of this, as approval of the Nord Stream 2 pipeline that would pipe Russian gas directly into Germany continues to await approval.
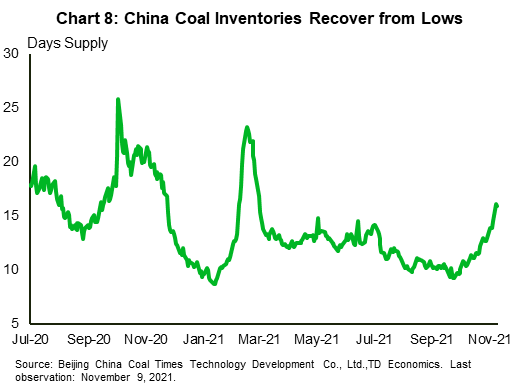
Lastly, many of China’s current problems are a byproduct of regulatory initiatives. As such, a loosening of regulations, or policy adjustments, will work to resolve the issues. For instance, measures have already been implemented to offset the pinch in energy markets. Coal futures prices are down roughly 50% as production and imports surged to improve inventories (Chart 8) and increase electricity output. Moreover, with the 20th Party Congress set for next year, it is highly unlikely that authorities will have much tolerance for instability in the economy. Appetite for slower growth in the second half of 2021 came off of a rapid rebound from the pandemic shock in early 2020. Going forward, should growth continue to slow, authorities will likely provide alternative supports for the economy.
What If We’re Wrong?
We expect the current issues to be largely resolved over the coming months, but with risks pulling on so many different threads, the odds of a forecast error are significantly higher. In this event, how might circumstances change? The analysis that follows highlights how a moderately adverse economic scenario might unfold.
The three factors presented above can have offsetting economic effects, so it’s useful to consider them together. First, we need to lay down some assumptions about the potential magnitude of the real estate shock in China. At one extreme, it would be a repeat of the type of housing market bust that preceded the Global Financial Crisis. Between 2005 and 2010, U.S. residential real estate investment fell an average of 16 percent per year, in Spain it was 9.9 percent per year out to 2013. These types of declines as associated with large scale economic meltdowns and are a bit more severe than what we’re looking for within a more command-controlled economy like China.
Table 1: Headline CPI Inflation Impacts (Year-over-Year % Change)
| Countries | 2022 | 2023 |
| Canada | 0.7 | -0.2 |
| United States | 0.8 | -0.2 |
| Eurozone | 2.3 | -0.6 |
For our purposes, we apply a 25% drawdown in China’s real private residential investment. This would bring investment back to its late 2017 level, before the most recent burst upwards. A housing price correction of roughly 25% is also assumed. Admittedly, the magnitude of this price shock is on the larger side – the U.S. saw a roughly comparable decline when the housing bubble burst, while Spain saw roughly a 30% pull-back.
Second, to capture the energy price effects in Europe, we assume that natural gas prices rise further as the arrival of new supplies doesn’t keep up with expectations – setting prices in the winter roughly 20% higher than currently expected. Relief does come, but not until the spring, with prices quickly moderating into the summer.
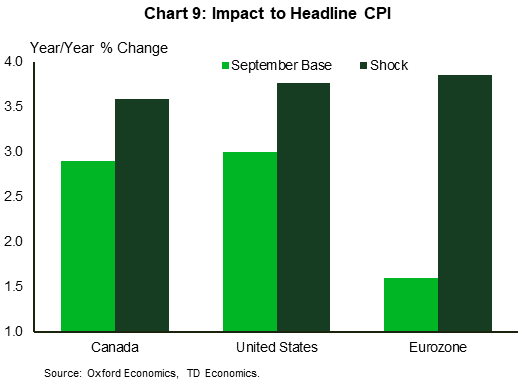
Lastly, we assume that supply-chain impacts are more prolonged, leading to persistently higher inflation relative to our September outlook (Chart 9). In this context, more persistent inflation works to slow economies by depressing real personal disposable income and forcing central banks to respond with tighter monetary policy.
Life is not so simple, however. While elevated gas prices and persistent supply-demand imbalances will drive inflation higher, a rapid deceleration in China’s property market represents a global disinflationary shock. Excess capacity is created, offsetting some of the inflationary pressures from the latter two shocks.
The real estate shock in China shaves 1.4 percentage points (p.p.) off growth in 2022, bringing it down to roughly 4% on an annual basis. Under these circumstances, Chinese authorities adopt a more accommodative monetary policy stance and ease liquidity conditions to prevent a broader collapse. Spillovers from China to the Eurozone and North America are relatively limited. Indeed, the monetary easing helps support Chinese exports to the rest of the world as the renminbi depreciates vis-à-vis the U.S. dollar.
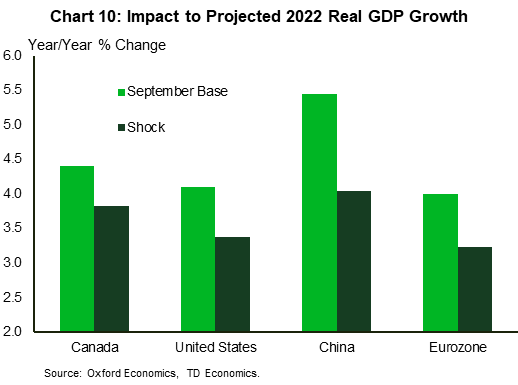
Table 2: Real GDP Impacts (Year-over-Year % Change)
| Countries | 2022 | 2023 |
| Canada | -0.6 | 0.0 |
| United States | -0.7 | 0.3 |
| Eurozone | -0.8 | 0.0 |
| China | -1.4 | 0.2 |
In North America, the supply-demand imbalance resulting from strained supply chains results in core inflation remaining above target in the U.S. and Canada into 2023. This has the dual effect of pushing interest rates higher and dampening real incomes. Higher rates come about as central bankers are forced to bring forward their anticipated rate hikes to tame price growth and keep inflation expectations anchored. In anticipation of this move, longer term bond yields move higher. Elevated borrowing costs work to reduce credit availability, weighing on overall demand. This, in effect, delays the recovery as the demand side of the economy cools to restore stable price growth.
Rising interest rates and a more challenging corporate operating environment hit equity valuations. U.S. equity prices correct 15% as investor optimism wanes. Falling asset prices dent consumer confidence as well, compounding the effect of lower real incomes on consumer expenditures.
The combined headwinds shave 0.7 p.p. from U.S. real GDP growth in 2022 (Chart 10). However, the shocks do not permanently impair the economy’s potential and so only serve to further delay the recovery. Indeed, the added pent-up demand begins to be released in 2023 lifting GDP growth 0.3 p.p. above what is currently anticipated.
The story in Canada is similar. The initial burst of inflation hits real incomes and spurs the central bank to lift rates more aggressively than previously expected. Offsetting some of the negative impacts to the economy are higher energy prices that support investment. This offers limited relief in 2022 as energy prices subside as demand moderates. All told, Canadian GDP grows by 0.6 p.p. less in 2022 and in line with our prevailing view in 2023. The foregone growth is distributed in 2024 and beyond as the economy plays catch-up (Chart 10).
In the Eurozone, the recent easing of gas prices proves temporary, and prices resume their upward march surprising another 20% to the upside and holding there through the first quarter of 2022. While the effects of supply chains are more muted than in the U.S., the shock to gas prices drives headline inflation 2.3 p.p. above our baseline. However, the ECB is still reluctant to lift rates, so longer term bond yields rise while the policy rate remains at the effective lower bound.
Combined with the other global shocks, 0.8 p.p. is cut from GDP growth in the common currency area next year. However, as natural gas prices begin to fall, they provide a deflationary impulse through the latter half of 2022 and into 2023. This effect helps keep the outlook for 2023 in line with what we expected in September and lays the foundation for out-performance in 2024.
Globally, the drag on GDP equates to roughly 0.6 percentage points next year, though this is obviously not equally distributed and concentrated in regions directly impacted by the factors studied here.
{related-articles-row}
Bottom Line
Our modelling suggests that under these simple assumptions, roughly $570 billion of real value-add in the global economy would be wiped out next year. The shock itself is of a moderate size and doesn’t result in a recession, but leaves an unenviable mix of slower growth and higher inflation. In addition, it’s very difficult to model the confidence channels, and greater fear-based behavior could undermine these projections further.
Again, this isn’t what we expect to happen. But it is prudent to plan for alternative scenarios given the high degree of uncertainty. We have provided one. There are of course other risk factors that could move the outlook further. Policy responses as the virus evolves continue to be the biggest wildcard in the global economy.
End Notes
- The effect of the pandemic on container volumes is slightly confounded by the trade war with China (remember the Phase One Trade Deal?). The trade war coincided with a decline in inbound container volumes that troughed with the initial phase of lockdowns in late spring 2020.
- Associated Press, “LA, Long Beach Ports Will Issue Fines for Backlogged Cargo”, https://apnews.com/article/business-california-los-angeles-long-beach-shipping-ffbbf935495b0bbea064bcbb1ce330cb
- Market Observatory for Energy, “Quarterly Report on European Gas Markets” Q2 2021, Vol. 14
- Reuters (Apr. 12, 2021) “China To Cut Coal Use Share to Under 56% in 2021”: https://www.reuters.com/world/china/china-cut-coal-use-share-below-56-2021-2021-04-22/
- China’s Mid-Century Long-Term Low Greenhouse Gas Emission Development Strategy, (Oct. 2021). https://unfccc.int/process/the-paris-agreement/long-termstrategies
- Financial Times, (July 20, 2021) “South-East Asia’s COVID Surge Poses Latest Blow To Global Chip Supply”, https://www.ft.com/content/7b678988-53d1-4a52-8866-28f109e88d79
- Wall Street Journal, (Oct. 4, 2021) “Empty Buildings in China’s Provincial Cities Testify to Evergrande Debacle”, https://www.wsj.com/articles/evergrande-chinareal-estate-debt-debacle-empty-buildings-cities-beijing11633374710
- Rogoff, Kenneth, and Yuanchen Yang. (2021). “Has China’s Housing Production Peaked?” China and the World Economy 21 (1): 1-31.
- OCED – Local Public Finance and Capacity Building in Asia : Issues and Challenges. Chapter 7 Municipal Finance and Property Taxation in China: https://www.oecd-ilibrary.org/sites/73c69466-en/index.html?itemId=/content/component/73c69466-en (Dec. 2020)
- Rogoff and Yang. (2021) “Has China’s Housing Production Peaked?” China and the World Economy 21 (1): 1-31.
- OCED – Local Public Finance and Capacity Building in Asia : Issues and Challenges. Chapter 7 Municipal Finance and Property Taxation in China (Dec. 2020): https://www.oecd-ilibrary.org/sites/73c69466-en/index.html?itemId=/content/component/73c69466-en
- Prakash Kannan, Alasdair Scott, and Marco E. Terrones. (2012) “From Recession to Reovery” IMF
- Financial Times (Nov. 2, 2021) “China Tells Citizens to Stockpile Food as COVID Controls are Tightened.” https://www.ft.com/content/f3f0414f-97a2-4c5a-8a7dda9e0e91d892
- BBC (Aug. 13, 2021), “Ningbo: Global Supply Fears as China Partly Shuts Major Port”: https://www.bbc.com/news/business-58196477
- Wall Street Journal (Nov. 1, 2021), “China Locks 30,000 Visitors Inside Shanghai Disneyland After One Guest Got COVID-19”: https://www.wsj.com/articles/shanghai-disneyland-suspends-operations-as-visitors-queue-for-covid-19-tests-before-exiting-11635755117?mod=hp_lead_pos10
- Financial Times (Nov. 2, 2021), “Four More UK Energy Suppliers Collapse.”: https://www.ft.com/content/366623b3-6932-4cb7-b0dc-f7192b551ccd
Disclaimer
This report is provided by TD Economics. It is for informational and educational purposes only as of the date of writing, and may not be appropriate for other purposes. The views and opinions expressed may change at any time based on market or other conditions and may not come to pass. This material is not intended to be relied upon as investment advice or recommendations, does not constitute a solicitation to buy or sell securities and should not be considered specific legal, investment or tax advice. The report does not provide material information about the business and affairs of TD Bank Group and the members of TD Economics are not spokespersons for TD Bank Group with respect to its business and affairs. The information contained in this report has been drawn from sources believed to be reliable, but is not guaranteed to be accurate or complete. This report contains economic analysis and views, including about future economic and financial markets performance. These are based on certain assumptions and other factors, and are subject to inherent risks and uncertainties. The actual outcome may be materially different. The Toronto-Dominion Bank and its affiliates and related entities that comprise the TD Bank Group are not liable for any errors or omissions in the information, analysis or views contained in this report, or for any loss or damage suffered.
Download
Share: