Global Inflation Update
Vikram Rai, Senior Economist | 416-923-1692
Paul Kim, Economic Analyst
Date Published: May 13, 2026
- Category:
- Global
- Global Economics
Highlights
- The global energy price spike due to the Middle East conflict has driven a sharp pickup in headline inflation across advanced economies, with early signs that we will see this in emerging markets soon.
- Headline inflation has picked up across the board, but some developed markets, such as Japan, the euro area, and Canada, have yet to see core prices move up.
- As a result, central banks have shifted to a more hawkish stance as this has complicated the policy outlook by pushing prices up even as it weighs on activity and already-softening labour markets.
Advanced Economies
Inflation across G-7 economies has accelerated following the run up in global energy prices stemming from the conflict in Iran. But the magnitude of the impact on inflation from this supply shock has been relatively larger for G7 members more reliant on oil and LNG from the Middle East, such as Japan, Germany, and Italy.
On a year-over-year (y/y) basis, U.S. headline inflation reached 3.8% in April, a leap from 2.4% in February, as energy prices soared 17.9% y/y (Chart 1). Over in the euro area, inflation rose to 3.0% in April from 1.9% in February, marking the highest level since September 2023. Headline inflation in France and Germany started picking up in March and reached 2.5% and 2.9% y/y, respectively, by April. Italy saw a more delayed reaction, with little movement in March, but inflation there also reached 2.9% y/y in April. However, on a rolling quarterly basis (3-month average/3-month average, annualized), inflation in Italy (5.7%) is running hotter than in Germany (2.9%) or France (2.1%). Across the euro area, energy prices rose 10.9% over the past year to April, flipping from February’s deflationary pace of -3.0%.
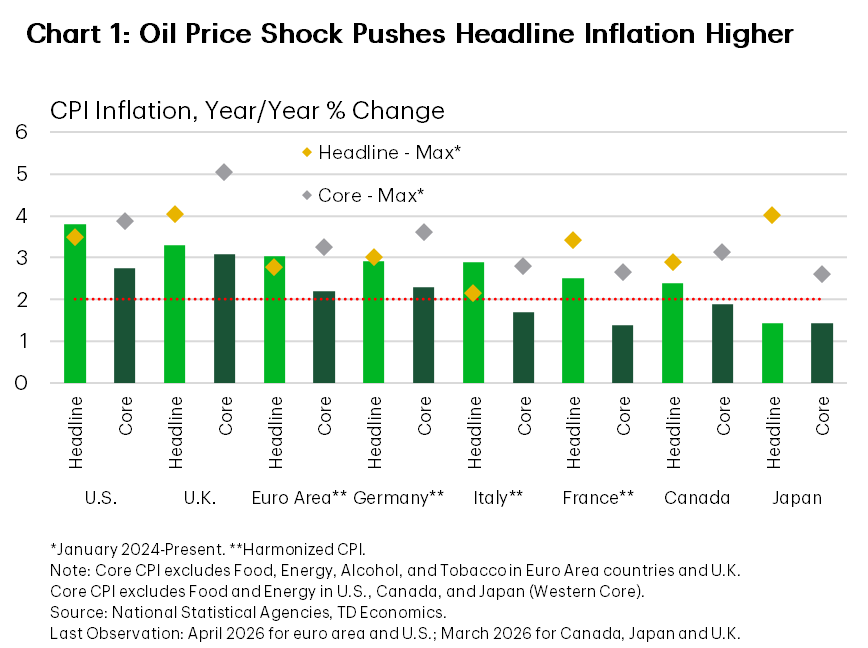
Outside of the euro area and the U.S., the latest data are still mainly for the month of March. Canada’s reignited energy inflation (3.9% y/y) — which for the past year was a significant source of disinflation following the removal of the consumer carbon levy — brought headline inflation (2.4% y/y) closer to the upper range of the past two years.
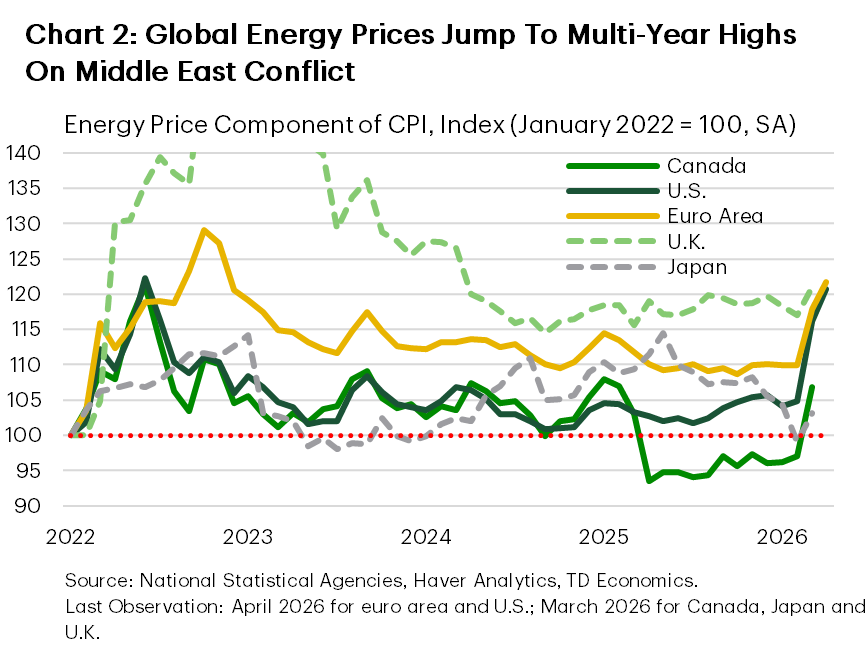
Meanwhile, Japan’s March inflation data showed a more muted response (1.4% y/y) with the surcharge on gasoline axed back in January and new subsidies rolled out to cap gasoline and other fuel prices soothing the impact. Nevertheless, energy prices have increased sharply on the month (4.1%), lessening their previous drag on headline inflation (Chart 2). At the same time, the tick-up in Tokyo CPI in April to 1.5% y/y points to some acceleration in national inflation ahead. U.K. consumer prices (3.3% y/y) were relatively insulated from the price shock thanks to the Ofgem1 gas and electricity price cap, though the shock did feed through to higher motor fuel prices (4.9% y/y). That second quarter Ofgem cap was ruled right before the Iranian conflict implies the inflationary impact from energy will be in full swing by in July, assuming prices remain at current levels.
Core And Input Prices
Stripping away the direct effect of the energy price shock and volatile food prices, core inflation measures show a diverging trend between countries (Chart 3). April readings from the euro area showed core inflation (2.5%, 3m/3m annualized) sitting not far from the ECB’s target, though price pressures in France (2.1%) and Italy (2.8%) have started to pick up. The quarterly measure showed a steady rise in U.S. core prices, inching higher to 3.0% from 2.8% in March and 2.4% in February. Elsewhere based on March observations, a deceleration in core inflation in Canada (1.4%) and Japan (0.7%) juxtaposed the rise in the U.K. (3.5%).
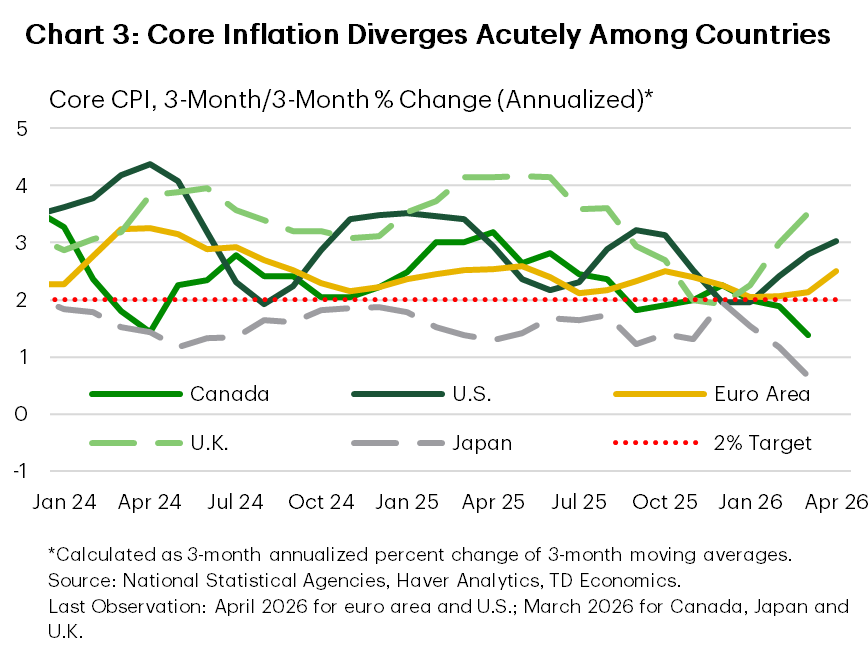
Services prices excluding housing has been growing at a rate above central bank targets outside of Japan (0.5%, 3m/3m, annualized) where it has slowed over the past few months. In contrast, services inflation has gained momentum in the U.K. (5.0% 3m/3m), with price increases attributable to rising travel, transportation, recreational and personal services prices.
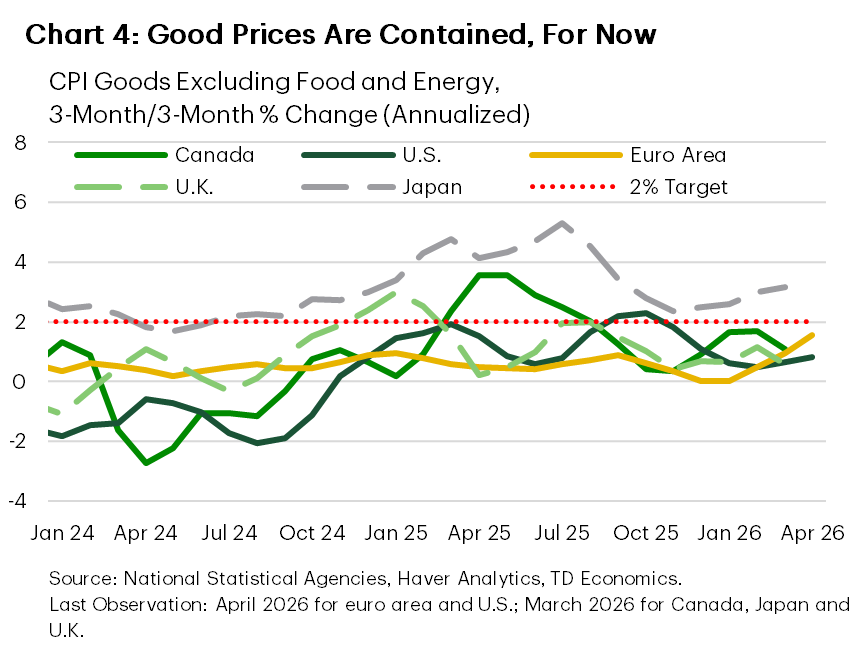
Core goods inflation has remained modest so far, coming in below the 2-handle on a rolling quarterly basis (Chart 4). The exception again was in Japan, where price growth picked up to 3.2% as rising import prices continued to meaningfully affect goods prices.
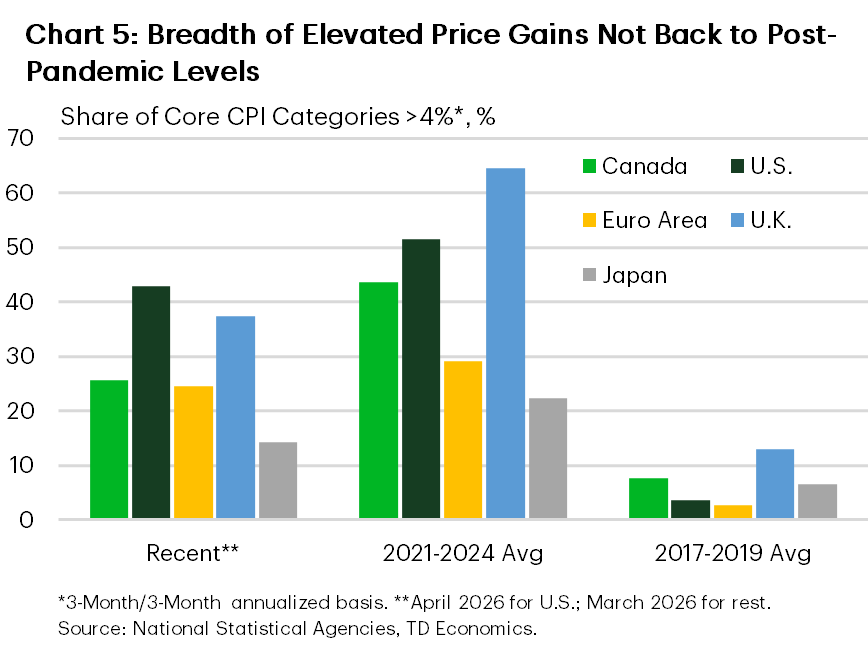
While the breadth of core inflation across the G7 has eased from its 2021-2024 average, it remains well-above pre-pandemic norms. In a troubling sign for the Fed, 43% of CPI categories in the U.S. saw price gains above 4% in April (3m/3m ann.), while the share of CPI categories experiencing deflation, at 18%, was lower than G7 peers. By comparison, Canada faced the energy shock from a better starting point. Not only was the share of deflating prices, at 36%, above the 2021-2024 average, but the share of items seeing elevated price growth has so far been contained at 26% (Chart 5).
Central banks will be on the lookout for signs of inflation broadening out to non-energy goods as the conflict continues to drag on. Price pressures have quickly built throughout production pipelines since the oil price breakout, with inflation in intermediate goods heading higher in the euro area (6.5% 3m/3m), U.K (8.2%) and the U.S (9.5%) according to March data.
In the case of Japan, persistent yen weakness has contributed to surging import prices (25.2% in March; 3m/3m). As the country relies critically on energy imports to meet domestic production needs, passthrough to consumers could occur in relatively short order. As for Canada, prices of raw materials surged 24% y/y in March, driven not only by the recent run-up in energy prices but also the upward trend in non-energy crude materials (22% y/y) that began last year. In turn, producer selling prices have increased 7.8% y/y as of March, pointing to increased pressure for consumer-facing businesses to raise prices.
Inflation Expectations
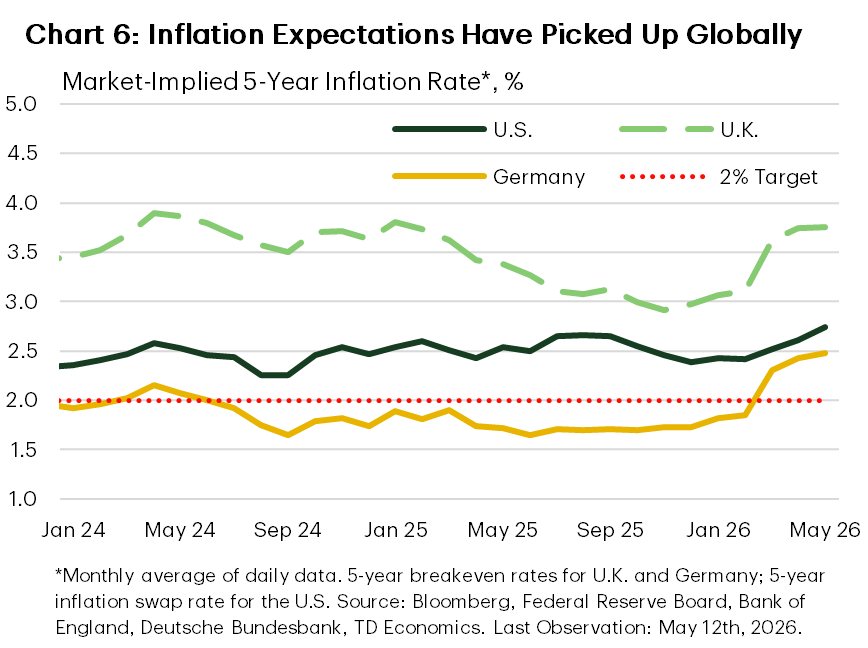
Market-based measures of inflation expectations have quickly latched on to higher energy prices (Chart 6). Based on the few data points we have for May, 5-year breakeven inflation rates are at multi-year highs, hovering around 2.5% in Germany, 2.7% in the U.S. while nearing 4% in the U.K. Germany’s ZEW Financial Market Survey complements the market view, with net 64.6% of participants now expecting a higher inflation backdrop over the next 6-months.
Owing to differences in survey periods, some surveys have not yet fully captured how consumers and businesses are responding to the energy price shock. Nevertheless, more timely indicators show significant increases in short-term inflation expectations, reflecting consumers’ immediate exposure to higher fuel prices. As of May 4th, retail gasoline prices in the U.S and Canada have gone up 50% since last December, while diesel prices in the euro area were 30% higher.
As such, the University of Michigan’s consumer survey showed U.S. one- and five-year inflation expectations rising to 4.7% and 3.5% in April before declining to 4.5% and 3.4% in May, respectively. Increased optimism for a U.S.-Iran deal at the time had sent oil prices lower and helped taper further rise in inflation expectations. Nevertheless, they represent a significant deviation from February levels.
While a dated picture, the European Commission’s Business and Consumer Survey showed the net balance of respondents expecting higher inflation rising to a four-year high in April (49%). In tune with this messaging were the survey responses from euro area’s professional forecasters who now see headline and core inflation rising to 2.1% and 2.2% y/y, both up from 2.0%, respectively. In an uncomfortable development for the ECB, consumer and business inflation expectations across Germany, France, and Italy have been rising in tandem since March, raising the risk that inflation expectations in its biggest member states become unanchored. More material declines in energy prices are likely required for expectations to return to pre-conflict levels.
Wage Growth
Wage growth across major economies has cooled significantly since their 2023/2024 peaks in line with cooler labour markets in most jurisdictions. While unemployment rates have come off their peaks, they remain above their pre-pandemic averages in Canada, U.S., U.K., and Japan. And in a tell-tale sign of lukewarm labour demand, employment growth outside of the U.K. has effectively flatlined—if not contracted—over the past year.
Productivity growth remains subdued in advanced economies with the sole exception of the U.S. Growing AI adoption among businesses is expected to further bolster the U.S.’s productivity supremacy. At the same time, AI’s disruptive role in tech and professional service occupations is a growing downside risk to wage growth.
A crucial difference in today’s inflation backdrop versus the post-pandemic inflation surge is that job markets are softer now. This has so far allowed central banks to opt for a “wait-and-see” approach as opposed to precautionary hikes to prevent repeating the mistake of labeling inflation as “transitory.”
Policy Rates
The shock to global energy prices has complicated outlooks for central bank policy. Before the conflict, labour markets had cooled visibly, and an array of uncertainties weighed on demand. But the shock to oil prices and global shipping has jerked inflation up once again. Now energy prices are near-certain to remain elevated without any meaningful progress towards a resolution of the conflict that would allow transit through the Strait of Hormuz to return to pre-conflict levels. This raises the likelihood that energy inflation spills over to broader categories of consumer goods. Such concerns were on full display during the string of central bank announcements at the end of April. Forward guidance struck a hawkish tone as central banks marked their inflation forecasts higher for 2026 even as rates remained on hold. With GDP growth running close to potential across advanced economies, our view is that higher energy prices will leave a dent on demand, dampening the knock-on effects of the energy shock on broader goods and services.
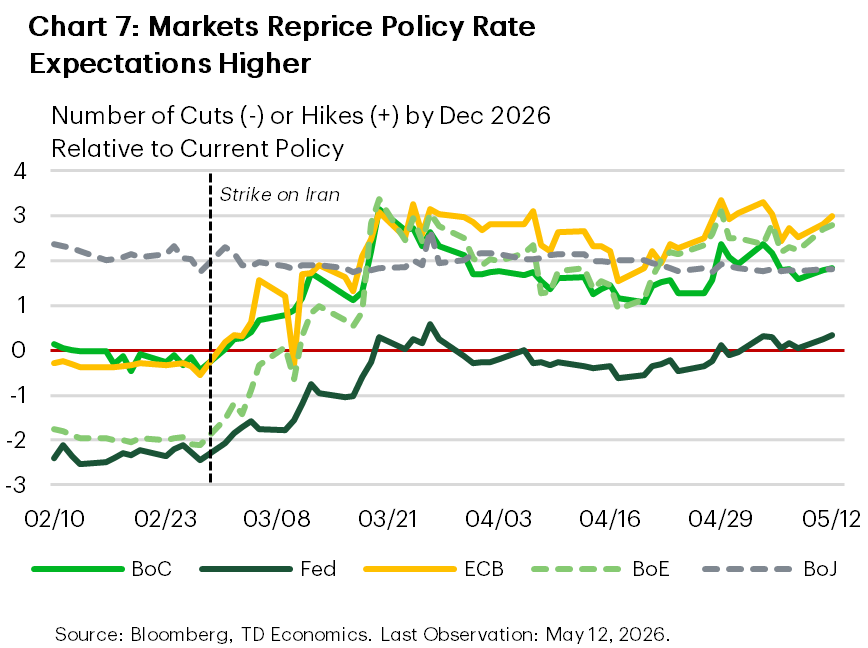
Market expectations for year-end policy rates have shifted accordingly (Chart 7). The Bank of Canada (BoC) is now expected to conduct two hikes by the end of 2026, up from zero in February. The rate pricing for the European Central Bank (ECB), which was also widely anticipated to stay on hold this year prior to the conflict, has jumped to three hikes as traders focus on the bloc’s heavy reliance on imported energy. Expectations swung widest for the Bank of England (BoE), as markets moved from pricing in two cuts back in February to three full hikes. As for the Federal Reserve (Fed), rate cut expectations for this year have evaporated despite the impending confirmation of Kevin Warsh, a Trump appointee, as the new Fed chair, and hike pressures are now building. Policy rate expectations for the Bank of Japan (BoJ) moved little since the onset of the Middle East conflict, though this is in part because rate hikes were already priced in and now the economic outlook is weaker. If anything, growing inflation pressures should allow for faster normalization of central bank policy in Japan.
Emerging Markets
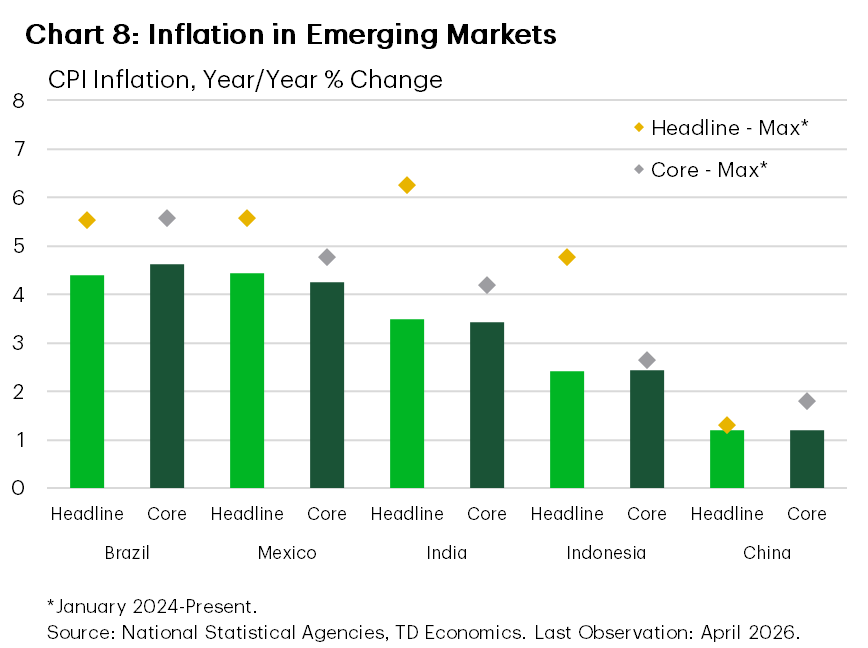
April inflation data for major emerging market countries collectively pointed to a renewed pickup in inflation pressures (Chart 8). Headline inflation in Vietnam (8.3% 3m/3m), Mexico (5.9%), South Korea (2.5%), Thailand (3.2%), Brazil (4.9%) and China (1.1%) accelerated from March while remaining generally unchanged in Indonesia (3.8%) and Taiwan (2.3%). India’s inflation pulled back to 7.0% in April from an elevated level of 8.3% in March.
Signs that price pressures have broaden out emerged as core price growth in South Korea (2.9%), Taiwan (4.0%), and Vietnam (6.8%) have picked up notably on the month. With energy prices still elevated, those equipped with domestic energy production capabilities are expected to better absorb the inflation impact, as was the case so far in Indonesia. Inflation trends across ASEAN economies will be closely monitored by global central banks, as the region’s prominent role in global manufacturing could transmit price pressures to advanced economies through higher import costs.
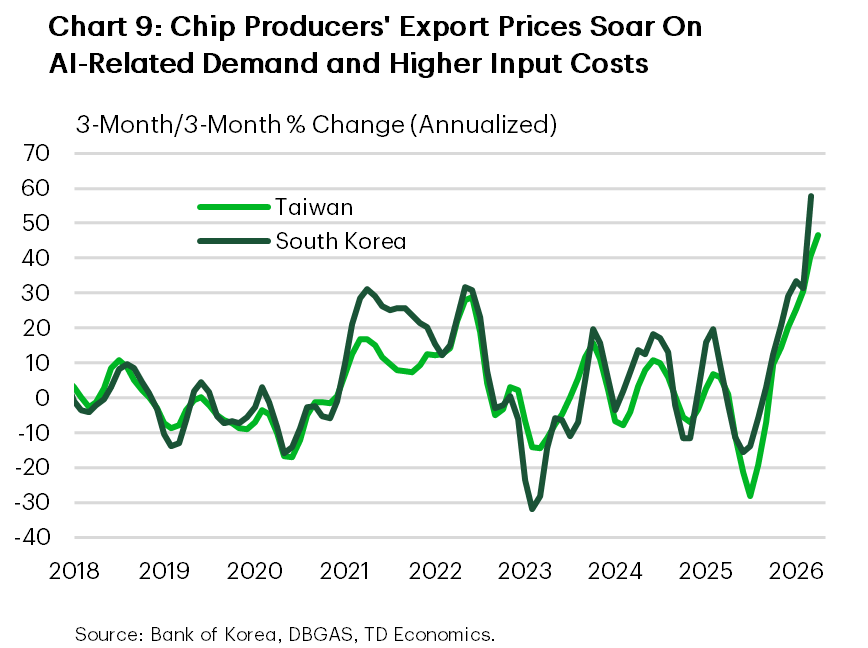
For example, prices of semiconductors and related components were grinding higher prior to the conflict. Higher energy costs have amplified that trend as production is deeply dependent on inputs derived from crude oil and natural gas, building on top of an already-squeezed global supply. In turn, Taiwan’s export prices have climbed by 46.6% (3m/3m annualized) as of April, while South Korea’s March data showed prices rising by 57.7% (Chart 9). The key risk here is that chip-flation could reach beyond AI to broader categories of consumer and business electronics, ultimately anchoring consumer expectations of inflation higher.
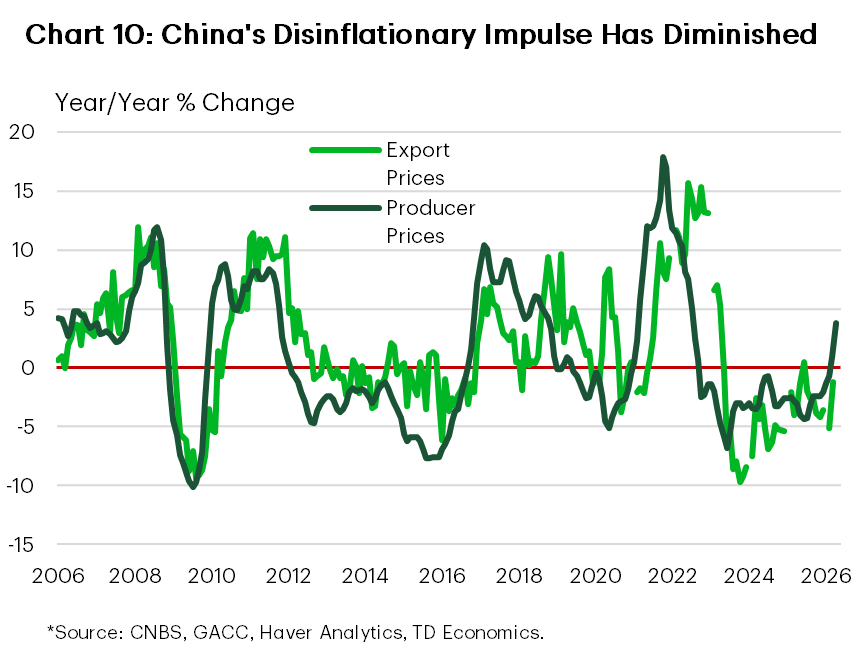
Adding to the list of worries for central bankers is China’s export prices, which look to be exiting a multi-year era of deflation as producer goods inflation accelerated in April (+3.8%) (Chart 10). Prolonged closure of the Strait raises the expectation that export prices will climb higher from here, marking the end of a once-dominant source of global disinflation.
Bottom Line
The current inflation shock is being driven first and foremost by energy costs, but the bigger risk is whether it starts to broaden into core goods, services and inflation expectations. For now, headline inflation is uniformly higher across advanced economies, while core inflation remains contained in places like Canada, Japan and the euro area, but is firmer in the U.S. and U.K.
Input-cost pressures are also building, particularly through intermediate goods, raw materials and import prices. To that extent, rising inflation in emerging markets, particularly in manufacturing-heavy economies, is expected to add upside pressure to consumer prices in importing advanced economies. Amidst rising inflation expectations, central banks are expected to remain cautious even as softer demand limits the risk of a broad-based acceleration in core inflation. The policy backdrop has become more complicated, with elevated energy prices driving the hawkish narrative of markets.
Tables
Table 1: Inflation Expectations
| Financial Measures* | |||||
| Country | Measure | Unit | Current Value | Change From Prior 3 Months | Last Obs. |
| Canada | 10-Year Breakeven Inflation Rate | % | 2.1 | Increased | May |
| U.S. | 5-Year Breakeven Inflation Rate | % | 2.7 | Increased | May |
| U.S. | 10-Year Breakeven Inflation Rate | % | 2.5 | Increased | May |
| Germany | 5-Year Breakeven Inflation Rate | % | 2.5 | Increased | May |
| Germany | 10-Year Breakeven Inflation Rate | % | 2.4 | Increased | May |
| U.K. | 5-Year Breakeven Inflation Rate | % | 3.7 | Increased | May |
| U.K. | 10-Year Breakeven Inflation Rate | % | 3.4 | Increased | May |
| Consumer Survey Measures | |||||
| Canada | Bank of Canada - Survey of Consumer Expectations | ||||
| Inflation Expectations - 2 Years Ahead | % | 3.6 | Decreased | Q1 | |
| Inflation Expectations - 5 Years Ahead | % | 3.0 | Decreased | Q1 | |
| U.S. | University of Michigan - Surveys of Consumers | ||||
| Inflation Expectations - 1 Year Ahead | % | 4.5 | Increased | May | |
| Inflation Expectations - 5 Years Ahead | % | 3.4 | Increased | May | |
| Euro Area | European Commission - Business and Consumer Survey | ||||
| Inflation Expectations - 1 Year Ahead | % Balance | 49.0 | Increased | Apr | |
| Germany | Deutsche Bundesbank - Survey on Consumer Expectations | ||||
| Inflation Expectations - 1 Year Ahead | % | 3.5 | Increased | Mar | |
| Inflation Expectations - 5 Years Ahead | % | 3.3 | Decreased | Mar | |
| Italy | ISTAT - Consumer Survey | ||||
| Inflation Expectations - 1 Year Ahead | % Balance | 84.0 | Increased | Apr | |
| U.K. | Bank of England/Ipsos - Inflation Attitudes Survey | ||||
| Inflation Expectations - 1 Year Ahead | % | 3.2 | Decreased | Q1 | |
| Inflation Expectations - 5 Years Ahead | % | 3.7 | Decreased | Q1 | |
| France | INSEE - Consumer Confidence Survey | ||||
| Inflation Expectations - 1 Year Ahead | % Balance | 11.1 | Increased | Apr | |
| Japan | Bank of Japan - Opinion Survey | ||||
| Inflation Expectations - 1 Year Ahead | % | 11.4 | Decreased | Q1 | |
| Business Survey Measures | |||||
| Canada | Bank of Canada - Business Outlook Survey | ||||
| Share of Firms Expecting Inflation Above 3% - 2 Years Ahead | % | 11.0 | Decreased | Q1 | |
| U.S. | Duke University - CFO Survey | ||||
| Inflation Expectations - 1 Year Ahead | % | 3.6 | Decreased | Q1 | |
| Euro Area | European Central Bank - Survey of Professional Forecasters | ||||
| Inflation Forecast - 1 Year Ahead | % | 2.1 | Increased | Q2 | |
| Inflation Forecast - 2 Years Ahead | % | 2.0 | Decreased | Q2 | |
| Inflation Forecast - Long-Term | % | 2.0 | Unchanged | Q2 | |
| Inflation Forecast - 1 Year Ahead (Core) | % | 2.2 | Increased | Q2 | |
| Inflation Forecast - 2 Years Ahead (Core) | % | 2.1 | Increased | Q2 | |
| Inflation Forecast - Long-Term (Core) | % | 2.0 | Unchanged | Q2 | |
| Germany | ZEW - Financial Market Survey | ||||
| Inflation Expectations - 6 Months Ahead | % Balance | 64.6 | Increased | May | |
| Italy | Bank of Italy - Survey on Inflation and Growth Expectations | ||||
| Inflation Expectations - 1 Year Ahead | % | 1.7 | Unchanged | Q1 | |
| Inflation Expectations - 2 Years Ahead | % | 1.7 | Decreased | Q1 | |
| U.K. | Confederation of British Industry - Distributive Trades Survey | ||||
| Inflation Expectations - 1 Year Ahead | % Balance | 1.7 | Increased | Q1 | |
| France | Bank of France - Monthly Business Survey | ||||
| Inflation Forecast - Finished Goods | % Balance | 11.1 | Increased | Mar | |
| Inflation Forecast - Services | % Balance | 4.8 | Increased | Mar | |
| Japan | Bank of Japan - Tankan Survey | ||||
| Inflation Expectations - 1 Year Ahead | % | 3.1 | Increased | Q1 | |
| Inflation Expectations - 3 Years Ahead | % | 4.6 | Increased | Q1 | |
| Inflation Expectations - 5 Years Ahead | % | 5.6 | Increased | Q1 | |
Table 2: Hourly Wage Growth
| Measures | Canada | U.S. | Germany* | Italy* | U.K.** | France | Japan*** |
| Current (Y/Y % Change) | 4.6 | 3.6 | 3.0 | 2.4 | 3.2 | 1.7 | 3.4 |
| 2022-2024 Max (Y/Y % Change) | 5.6 | 5.9 | 7.0 | 7.3 | 8.2 | 5.4 | 4.8 |
| 2017-2019 Average (Y/Y % Change) | 2.4 | 3.0 | 2.6 | 1.0 | 2.8 | 1.5 | 1.5 |
| Last Observation | Apr | Apr | Feb | Mar | Feb | Dec | Mar |
End Notes
- The Ofgem price cap sets the maximum unit rates and standing charges that energy suppliers in Great Britain can charge households on standard variable/default tariffs.
Disclaimer
This report is provided by TD Economics. It is for informational and educational purposes only as of the date of writing, and may not be appropriate for other purposes. The views and opinions expressed may change at any time based on market or other conditions and may not come to pass. This material is not intended to be relied upon as investment advice or recommendations, does not constitute a solicitation to buy or sell securities and should not be considered specific legal, investment or tax advice. The report does not provide material information about the business and affairs of TD Bank Group and the members of TD Economics are not spokespersons for TD Bank Group with respect to its business and affairs. The information contained in this report has been drawn from sources believed to be reliable, but is not guaranteed to be accurate or complete. This report contains economic analysis and views, including about future economic and financial markets performance. These are based on certain assumptions and other factors, and are subject to inherent risks and uncertainties. The actual outcome may be materially different. The Toronto-Dominion Bank and its affiliates and related entities that comprise the TD Bank Group are not liable for any errors or omissions in the information, analysis or views contained in this report, or for any loss or damage suffered.
Download
Share: