G-7 Inflation Update: Energy Prices Erode Spending Power
Andrew Hencic, Senior Economist | 416-944-5307
Date Published: May 20, 2022
- Category:
- Global
Highlights
- Inflation continued to accelerate across the G-7 into April as the effects of rising food and energy prices continue to be felt.
- Moving forward, higher interest rates and reduced real disposable incomes will weigh on demand and help to cool inflation by narrowing the wedge between demand and supply.
It's inflation week in the G-7 as the European Union, the U.K., Canada, and Japan all released detailed April inflation numbers. The U.K. made headlines as the consumer price index (CPI) measure reached an eye-watering 9.0% year-over-year (y/y) – the broader measure that includes homeownership services advanced by a more modest 7.8%. Even in Japan, inflation hit a seven and a half year high as headline CPI growth reached 2.5%. In general, the surge in energy prices is the rising tide that is lifting the cost of living at a multi-decade high pace.
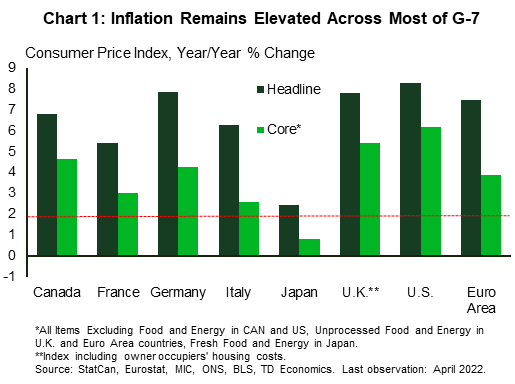
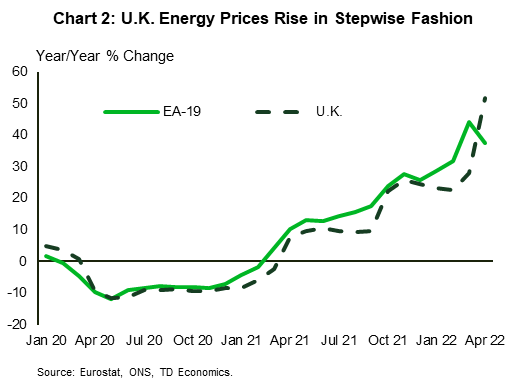
Headline CPI for April in the euro area was 7.3% y/y, while the measure excluding food and energy moved to 3.8%. By comparison, the U.S. registered 8.3% headline and 6.2% core advances, while Canada's release this week showed a 6.8 % and 4.6% increase (Chart 1). The magnitude of the energy shock Europe is witnessing now can't be understated. Energy prices are up 37.4% y/y, more than 7.4 percentage points ahead of the U.S. and a whopping 32.0 percentage points more than Canada. In the U.K., April saw the semi-annual adjustment to price caps on retail energy products. The cap increase produces abrupt jumps in energy costs followed by relative lulls (like a staircase) that ultimately tracks with the smoother European price profile (Chart 2).
That said, core measures (excluding food and energy) of inflation in most of the G-7 countries are well ahead of policymakers' targets. This reflects demand continuing to outstrip supply as the global economy reckons with a sequence of supply-side shocks.
As inflation continues to accelerate central bankers are concerned about longer-term inflation expectations rising and the entrenchment of a wage-price spiral. That's a key part of the reason why they continue to signal more monetary tightening despite the risk of a slowdown in growth.
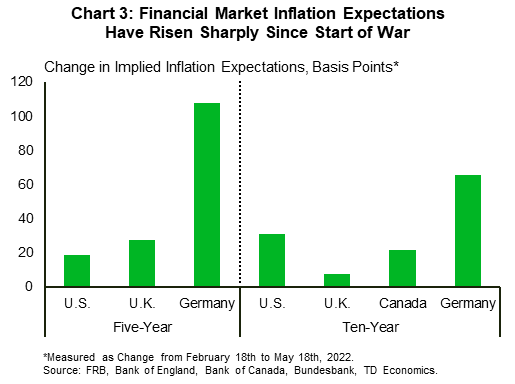
Indeed, financial market inflation expectations over the next five-to-ten years have moved higher in concert with the surge in energy prices (Chart 3). Using the last readings from the pre-Ukraine war period as the starting point shows market expectations have drifted higher for the U.S., the U.K. and Canada. Not surprisingly, for Germany (here a proxy for the euro area) sentiment has shifted the most as concerns about energy supplies have bled into price expectations. Markets are now preparing for an average of an additional percentage point of inflation over the next five years.
However, monetary policy is not being tightened at an equal pace around the G-7. For instance, market implied pricing suggests that policy rates in Canada and the U.S. will approach 3 percent by late-2022, but still be below 1 percent in the euro area.
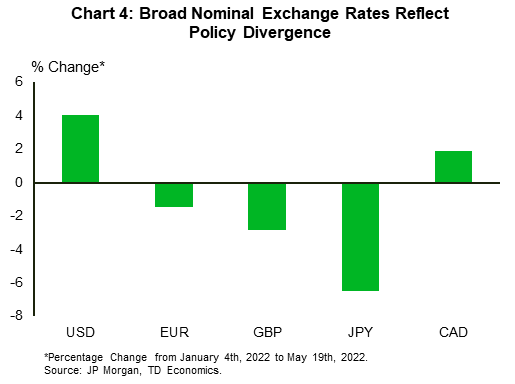
This divergence in expected rates is reflected in currency markets. The U.S. dollar has had an impressive run, appreciating 4.5% on a trade weighted basis (Chart 4). Conversely, the yen, British pound, and euro have given back 6.8%, 2.5% and 1.7% this year, respectively, amplifying inflationary forces. The Canadian dollar continues to hold its own as the Bank of Canada remains committed to an aggressive rate hiking cycle.
Higher interest rates will work to weaken demand growth, albeit with a lag. The effect of inflation on purchasing power will be more immediate. Measures of wages in the U.K. and Europe are not keeping up with inflation. Average weekly earnings in the U.K. (adjusting for purchasing power) are up 3.5% y/y but, when bonuses are excluded, underlying real wages are down 2.0%. Euro area measures are released with a significant lag, but collectively bargained pay in Germany and Italy (which generally track underlying wage growth) are also lagging inflation. Notably, real hourly contractual wages in Japan were up 1.3% in March. Although, after years of below target inflation, rising wages kickstarting inflation in Japan may be a welcome sign. Except for Japan, wage growth is not keeping up with inflation, so consumers will either be tapping accumulated savings or scaling back on purchases.
Moving forward, output growth will slow through the latter half of the year as inflation and higher interest rates erode purchasing power and slow expenditures. The softer demand backdrop will also help to cool inflation as the wedge between demand and supply narrows.
Disclaimer
This report is provided by TD Economics. It is for informational and educational purposes only as of the date of writing, and may not be appropriate for other purposes. The views and opinions expressed may change at any time based on market or other conditions and may not come to pass. This material is not intended to be relied upon as investment advice or recommendations, does not constitute a solicitation to buy or sell securities and should not be considered specific legal, investment or tax advice. The report does not provide material information about the business and affairs of TD Bank Group and the members of TD Economics are not spokespersons for TD Bank Group with respect to its business and affairs. The information contained in this report has been drawn from sources believed to be reliable, but is not guaranteed to be accurate or complete. This report contains economic analysis and views, including about future economic and financial markets performance. These are based on certain assumptions and other factors, and are subject to inherent risks and uncertainties. The actual outcome may be materially different. The Toronto-Dominion Bank and its affiliates and related entities that comprise the TD Bank Group are not liable for any errors or omissions in the information, analysis or views contained in this report, or for any loss or damage suffered.
Download
Share: