Eurozone Inflation: More than Meets the Eye
Andrew Hencic, Senior Economist
Date Published: December 23, 2021
- Category:
- Global
- Global Economics
- Europe
Highlights
- Inflation in the Eurozone hit 4.9% year-over-year in November, the highest rate on record. Yet unlike central banks in the U.S., U.K., and Canada, the ECB continues to show tremendous patience in tightening policy.
- Looking under the Eurozone’s inflation hood shows rising energy prices are the main culprit behind the current run-up in inflation and their effect should wane in late-2022. Moreover, the core working age participation rate has almost fully recovered to pre-crisis levels, mitigating labor shortages.
- The ECB will continue to maintain its accommodative policy as it looks to re-establish inflation expectations and meet the medium-term 2% inflation target.
Consumer price inflation in the Eurozone doesn’t quite match the 6.9% year-over-year (y/y) registered in the U.S., but at 4.9% it is the highest on record and outstrips the 4.6% prints in the U.K. and Canada. Yet, as other central banks have tightened monetary conditions, the European Central Bank (ECB) continues to show tremendous patience and projects inflation will fall below its 2% target in 2023. Indeed, at its last meeting policy makers announced a gradual tapering of quantitative easing, winding down one asset buying program while accelerating another, and left rate hike decisions for after 20221. In this paper we take a look under Eurozone’s inflation hood to reconcile current circumstances with the cautious approach. We find that despite the recent surge in price growth, there remain risks to sustainably achieving the 2% target over the medium term.
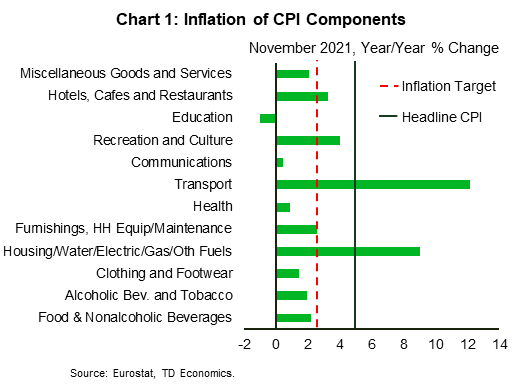
First up, the inflation surge in Europe has continued to show surprisingly little breadth across consumer categories. For example, housing and transportation – two areas that comprise 31.5% of the overall index – have been behind the bulk of the inflationary impulse (Chart 1). Most other areas are still recording annual price increases running at around 2% or lower, although the recreation and culture category is showing some verve – lifted by a 6.4% y/y pop in packaged holiday prices in November.
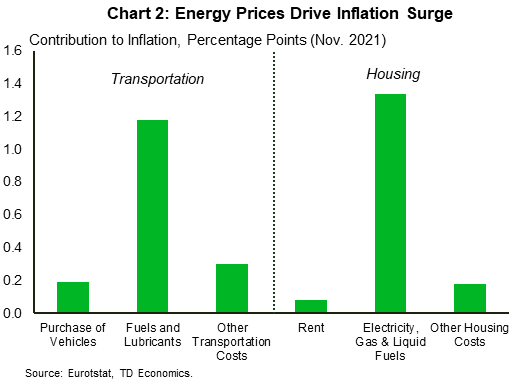
Even within the housing and transportation areas, much of the acceleration can be explained by one key culprit: energy prices. In fact, as of November, energy prices were responsible for roughly three quarters of the increase in those two components and more than half of the overall inflation in the Eurozone. The two main avenues through which they pass through are in the price of fuels and lubricants for automobiles and electricity, gas and liquid fuel costs for homes (Chart 2). These two categories added approximately 2.5 percentage points to November inflation (out of the 4.9% overall increase).
Certainly, rising energy prices take a major bite out of household disposable income, but the ECB is going to be reticent to change course on monetary policy in response to its volatile movements. Indeed, the last month has seen Brent crude and natural gas prices diverge. The former has fallen 14%, while the latter has recouped November’s losses and hit a new record. The ECB, and indeed our own baseline forecast, still anticipates a reduction in natural gas and crude oil prices from 2022 to 2023. For European natural gas, specifically, we continue to assume a peaceful resolution to tensions between Ukraine and Russia will be reached, normalizing gas deliveries.
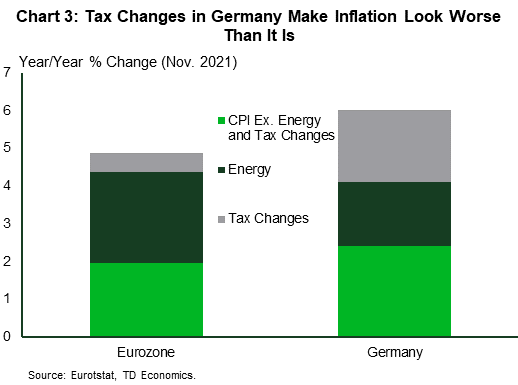
Beyond energy prices, tax changes have had a material impact on the current inflation readings. In response to the pandemic in 2020, governments around the world unfurled fiscal stimulus to help insulate their economies from the negative demand shock. Beyond simple cash transfers and wage subsidies, tax cuts were used to help support firms and consumers. Germany’s case is instructive here. In July 2020, Germany enacted a temporary VAT (value added tax) cut, trimming the general rate to 16% (from 19%) and the reduced rate to 5% (from 7%). Most of these measures expired in December 2020, meaning prices were set to rise in January 2021.
In Germany, the tax effects have added 1.9 percentage points alone to its annual inflation rate, whereas in the overall Eurozone, the hit has been a sizeable 0.5 percentage points (Chart 3). Yet, in much the same way the ECB is looking through the surges in energy prices, they will look beyond these one-time changes in price levels as well.
Not all of the recent acceleration in inflation can be pinned on energy prices and tax changes. In particular, as the economic reopening in Europe gained steam, price pressures have broadened. The three-month annualized rate of core inflation is now 3.5%, a rate that, before 2021, hadn’t been seen since the early 1990s. Though this is currently above the 2% target, the ECB looks to ensure price stability “over the medium term”2.
Still, if we (once again) take a step back and look at trends over a two-year period, core price inflation is still only registering +1.5% (annualized), still well short of where the ECB would like it to be. For some perspective, the two-year change in core CPI in the U.S. ticked up to 3.3% (annualized) in November, while the three-month rate is 4.1%.
Lastly, it is worth noting that the ECB is currently examining expanding housing costs measures beyond actual rents to include owner’s equivalent rents (a proxy for the benefits of owning housing). Given the rapid appreciation of housing prices over the past year, this would have contributed a further 0.2-0.3% to inflation this year3, sending core price inflation closer to 3% y/y.
What Are The Leading Indicators Showing?
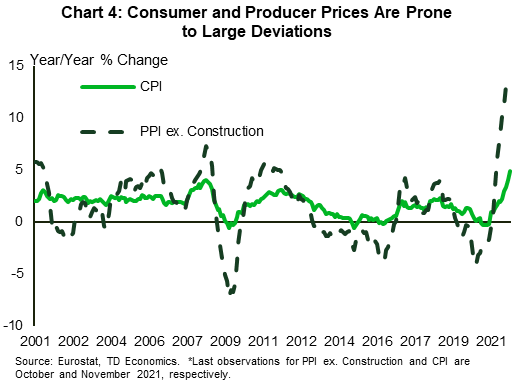
Similar to other regions, global supply chain bottlenecks continue to be a problem and are putting pressure on producer margins. These costs are going to eventually be passed on to end consumers but, the timing of the pass-through isn’t clear cut. With margins able to absorb input price shocks, the relationship between producer and consumer prices tends to be tenuous (Chart 4). However, the recent divergence between consumer and producer inflation is the largest going back to 2001 and so we look to consumer prices to respond.
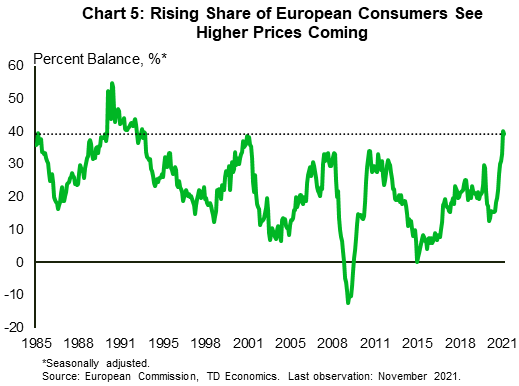
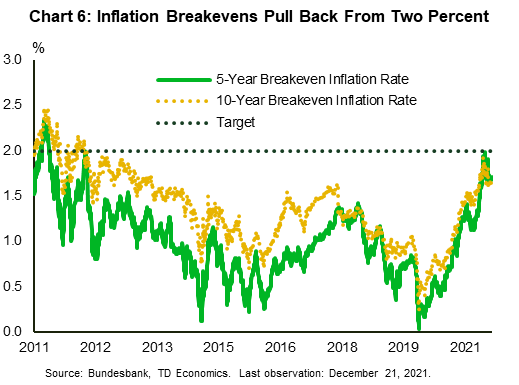
Market participants and households appear to also be expecting more price hikes on the way. The most recent Survey of Professional Forecasters showed the mean projection for inflation next year was 1.9%, up from 1.2% prior to the pandemic. At the same time, the European Commission Business and Consumer Survey shows the balance of opinion expecting higher prices next year holding at 28-year highs (Chart 5). It’s important to note that policymakers are looking to establish inflation expectations around 2%4, so these increases will be viewed as a good thing. In fact, there is still room for improvement over the longer term as German 5- and 10-year breakeven inflation rates are still well below 2% (Chart 6), and the ECB’s own projections show inflation at 1.8% in 2023 and 2024.
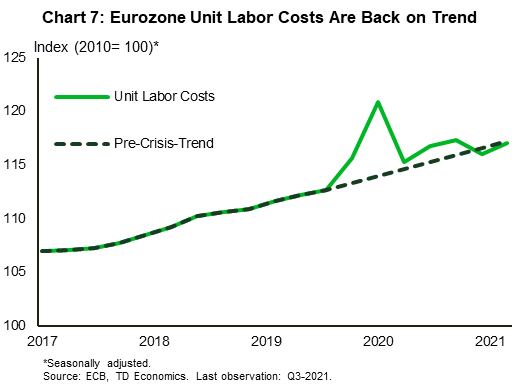
Despite expectations of higher prices, labor costs are back in line with pre-pandemic trends. Data from the third quarter show unit labor cost (the labor cost associated with a unit of GDP) has moderated since surging during the initial March 2020 lockdowns (Chart 7). Indeed, extrapolating the average growth rate from the two years prior to the pandemic shows that labor costs per unit of GDP are roughly in line with where they would have been had the pandemic not occurred.
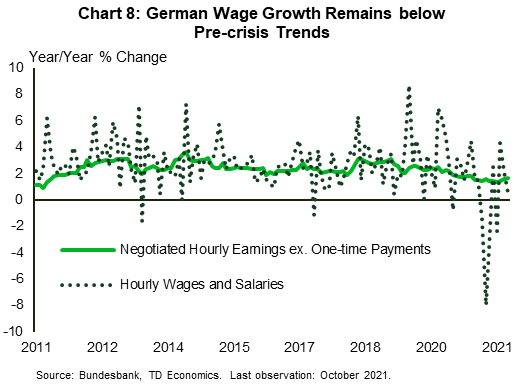
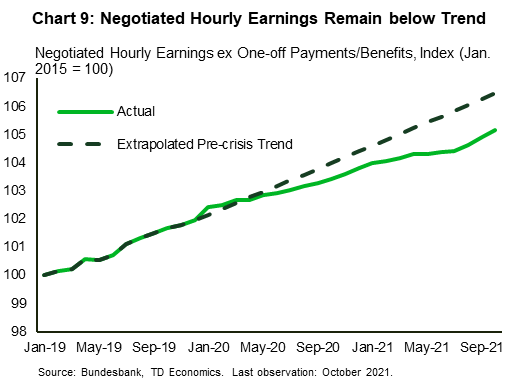
Of course, third quarter data are already a bit stale. More timely monthly data of negotiated wages are available from the Bundesbank in Germany. The latest data show over half of workers in Germany are covered by collective bargaining agreements5 and movements in negotiated wages are broadly indicative of general trends (Chart 8). Negotiated wage growth continues to be below its pre-pandemic trend, and indeed has quite a bit of room to rise to catch up to its pre-pandemic trajectory (Chart 9).
Lastly, the Euro has weakened since mid-year, in particular vis-à-vis the U.S. dollar (-7.8% y/y) and U.K. pound (-6.3% y/y), adding to the inflationary backdrop. We see this trend reversing, with the euro beginning its recovery by late 2022 and providing a slight offset to the recent inflationary effects.
.
What Can We Expect in 2022?
We expect headline inflation in the Eurozone to peak in the fourth quarter of 2021 on a year-over-year basis. Relief at the start of 2022 will come as the effects of tax changes fall out. The real slowing will come in the spring and early summer as the winter heating season passes and unusually low gas supplies can be restocked. Indeed, even without outright price declines, the effect of energy prices on inflation will moderate as the base effects fade.
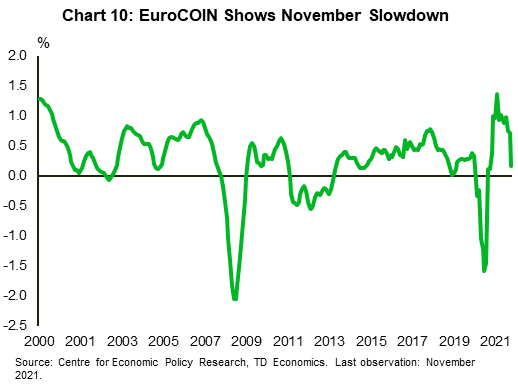
The near-term outlook for core inflation is considerably muddier due to a number of cross-currents. Consumer activity in the Eurozone has moderated sharply in November as measures of mobility and the EuroCOIN indicator (Chart 10) both reflect consumer hesitancy in the face of increased COVID-related restrictions. The economic reopening that powered growth in consumer demand in the third quarter is being sharply curtailed and – along with softening energy prices - will offset some of the price inflation.
As this wave of cases and restrictions passes and demand picks up again, constrained supply chains will continue to exert pressure on margins. Every round of the pandemic has brought about more strain for producers and should demand remain resilient, producers will respond with raising prices. Yet, towards the end of 2022, pressure on supply chains should ease, bringing some relief to margins and help slow price growth.
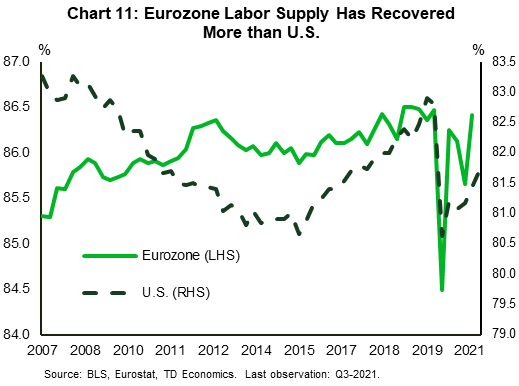
Turning to demand, the expectations-wage spiral has yet to materialize and decreased demand in the winter months could further restrain wage pressure. Moreover, unlike the U.S., workers have remained attached to the labor market, preserving the labor supply (Chart 11). As labor is relatively less scarce, wage pressures like those in the U.S. aren’t expected. So, while the start of the year will feature stronger core inflation, these factors should help to bring it back below the two percent target by early 2023
Of course, there is risk of a colder than expected winter driving energy prices higher (touched on here). Geopolitical risk has also increased recently as tensions between Russia (Europe’s largest supplier of natural gas) and Ukraine continue to rise. The possibility of added economic sanctions and further delays to the approval of the Nord Stream 2 pipeline are material risks. Indeed, after a period of relative stability in early December, natural gas prices have again risen 97% (as of writing), reaching new record highs. That said, although there is tremendous uncertainty, we continue to expect energy price pressures to recede in the spring.
Beyond energy prices, we have seen demand prove to be more resilient to the ebbs and flows of the pandemic than supply. This winter is already seeing another wave of infections and restrictions. Shutdowns and supply chain interruptions could limit goods and input supplies, leading to another burst of core price inflation next year if demand bounces back faster than anticipated.
{related-articles-row}
Bottom Line
European inflation has grabbed headlines, but the price growth can be largely attributed to energy prices and temporary changes in tax policy. As we move into 2022, and these factors become less forceful, fundamentals like wage costs and expectations will be key in determining the persistence of inflation. On both fronts, we don’t see any red flags as of yet, but both warrant close monitoring.
However, there is a tremendous amount of uncertainty surrounding the outlook. The emergence of the Omicron variant and geopolitical tensions between Russia and Ukraine could seriously disrupt the economy. This uncertainty was underscored by ECB president Lagarde at last week’s Monetary Policy Statement press conference where she stressed the need for “flexibility and optionality”6 in monetary policy going forward. So, while extraordinary factors have driven inflation sharply higher this year, policymakers will proceed cautiously in the hopes re-anchoring inflation. expectations at 2% and hitting their medium-term inflation target.
End Notes
- Christine Lagarde, (Dec. 16, 2021), “Monetary Policy Statement – Press Conference”: https://www.ecb.europa.eu/press/pressconf/2021/html/ecb.is211216~9abaace28e.en.html
- ECB: What is Monetary Policy? https://www.ecb.europa.eu/ecb/educational/explainers/tell-me/html/what-is-monetary-policy.en.html
- Jens Wideman, (Jul. 24, 2021), “Inflation Rates Going in the Direction of 5%” Deutsche Bundesbank: https://www.bundesbank.de/en/press/interviews/-inflation-rates-going-in-the-direction-of-5--869910
- Reuters, (Oct. 5, 2021) “ECB to zoom in on inflation expectations, wages: Lagarde” https://www.reuters.com/world/europe/ecb-zoom-inflation-expectations-wages-lagarde-2021-10-05/#:~:text=%22We%20should%20not%20overreact%20to,2%25%2C%22%20she%20said.
- Deutsche Bundesbank Eurosystem, “Negotiated Pay Rates and Labor Costs”, : https://www.bundesbank.de/en/statistics/economic-activity-and-prices/negotiated-pay-rates-and-labour-costs/negotiated-pay-rates-and-labour-costs-795514
- Christine Lagarde, (Dec. 16, 2021), “Monetary Policy Statement – Press Conference”: https://www.ecb.europa.eu/press/pressconf/2021/html/ecb.is211216~9abaace28e.en.html.
Disclaimer
This report is provided by TD Economics. It is for informational and educational purposes only as of the date of writing, and may not be appropriate for other purposes. The views and opinions expressed may change at any time based on market or other conditions and may not come to pass. This material is not intended to be relied upon as investment advice or recommendations, does not constitute a solicitation to buy or sell securities and should not be considered specific legal, investment or tax advice. The report does not provide material information about the business and affairs of TD Bank Group and the members of TD Economics are not spokespersons for TD Bank Group with respect to its business and affairs. The information contained in this report has been drawn from sources believed to be reliable, but is not guaranteed to be accurate or complete. This report contains economic analysis and views, including about future economic and financial markets performance. These are based on certain assumptions and other factors, and are subject to inherent risks and uncertainties. The actual outcome may be materially different. The Toronto-Dominion Bank and its affiliates and related entities that comprise the TD Bank Group are not liable for any errors or omissions in the information, analysis or views contained in this report, or for any loss or damage suffered.
Download
Share: