Lessons Learned: Emerging Markets and the
U.S. Dollar
Andrew Hencic, Senior Economist | Andrew.Hencic@td.com
Date Published: November 9, 2022
- Category:
- Global
- Global Economics
Highlights
- The U.S. dollar has appreciated sharply this year. However, much of its strength has been vis-à-vis advanced market currencies, rather than those of emerging markets (EM).
- Portfolio flows to EMs are down sharply so far in 2022, but the decline is more modest than prior periods of financial stress.
- Pockets of fragility exist but many EMs have entered this rate hiking cycle in relatively solid position and should be able to withstand the coming challenges.
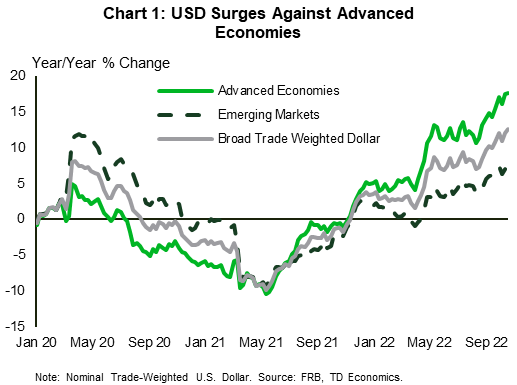
An appreciating U.S. dollar and a rapidly tightening Fed conjure up memories of sovereign debt troubles and balance of payment crises in emerging markets (EMs). Adding to the worries are results from the IMFs recent Global Stress Test suggesting that up to 29% of EM banks could breach key capital ratios in the event of a severely adverse economic scenario1. It's always dangerous territory to say "it's different this time", but major EMs have evolved their safeguards and are not displaying the stress-points of past cycles - or, at least, not yet. This is partially reflected by much of the dollar's appreciation being vis-à-vis advanced market economies, rather than their emerging market counterparts (Chart 1)2. While pockets of fragility exist, many EMs have entered this rate hiking cycle in relatively solid position and should be able to withstand the coming challenges.
A hawkish Fed and global economic concerns have driven a flight to safety out of risk assets and into the U.S. dollar. This has lifted the dollar 12.6% year-over-year (on a trade weighted basis). However, it has appreciated 17.6% against advanced economies and only 8.1% against emerging markets.
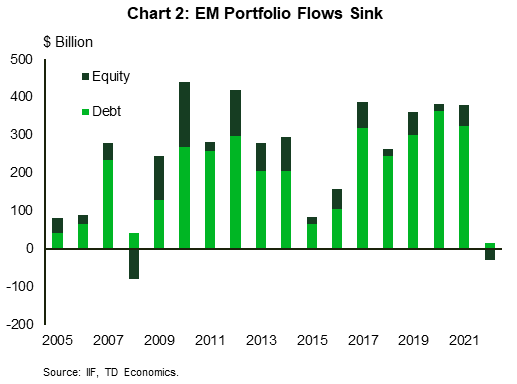
That said, portfolio flows to EMs (closely tied to asset prices) are down sharply this year (Chart 2). In the first nine months of 2022, emerging markets portfolio outflows have totaled $13 billion. In the grand scheme of things, this is modest when benchmarked to other periods of financial stress. For instance, in the nine months to July 2008, EMs experienced a $115 billion exit in funds. However, this year's pattern is a sharp reversal in investor sentiment when compared to the $332 billion in net inflows over the same period last year. Indeed, even after excluding China from the EM basket, net flows are down nearly 75% – from $190 billion this time last year to roughly $48 billion this year. Current circumstances are reminiscent of the toxic combination that precipitated EM sovereign debt crises' in the past.
Most outflows have, unsurprisingly, been concentrated in equity markets. Excluding China, this has totaled roughly $27 billion through September, compared to outflows of $15 billion through the first nine months of 2021. Despite China's well-publicized struggles, equity outflows have totaled only $2 billion this year.
In contrast, debt markets in most EMs continue to attract capital, albeit at a much reduced pace from last year. Through September, total debt portfolio flows are down 94% (to $17 billion) from the same period last year. This is largely attributed to one EM – China – where outflows have totaled $59 billion. As investors move money to the relative safety of the U.S. dollar, emerging markets are feeling the brunt.
Yet, despite capital moving out of emerging market investments, their currencies are holding up better against the U.S. dollar than their advanced economy counterparts (Chart 1). This reflects, in part, the fact that many EMs are entering this rate hiking cycle with healthy reserves and a hawkish monetary policy stance. For instance, among some of the United States' largest trading partners, most ended 2021 with reserve balances well in excess of the IMF's Adequate Reserves Metric (Table 1).
Table 1: Reserve Adequacy
| 2018 | 2019 | 2020 | 2021 | 2022** | |
| Major EMs Ex. China | 154 | 154 | 168 | 169 | 141 |
| Argentina | 122 | 72 | 68 | 71 | 66 |
| Brazil | 166 | 147 | 164 | 162 | 133 |
| Chile | 91 | 86 | 84 | 111 | 77 |
| Colombia | 130 | 136 | 144 | 139 | 124 |
| Indonesia | 116 | 115 | 125 | 126 | 106 |
| India | 144 | 162 | 193 | 200 | 159 |
| Israel | 267 | 264 | 278 | 279 | 233 |
| Korea | 112 | 108 | 99 | 99 | 85 |
| Malaysia | 114 | 115 | 119 | 122 | 98 |
| Mexico | 116 | 114 | 127 | 128 | 121 |
| Philippines | 189 | 201 | 237 | 230 | 194 |
| Russia | 295 | 304 | 358 | 339 | 290 |
| Thailand | 209 | 216 | 248 | 244 | 193 |
| China | 89 | 85 | 75 | 69 | 58 |
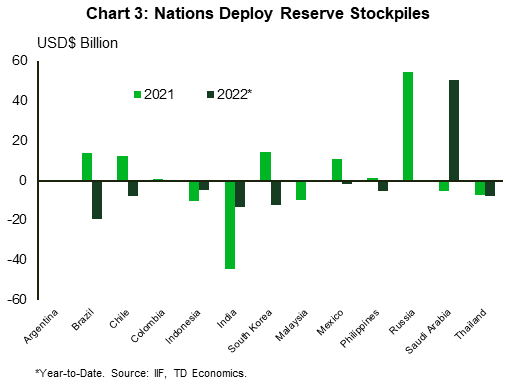
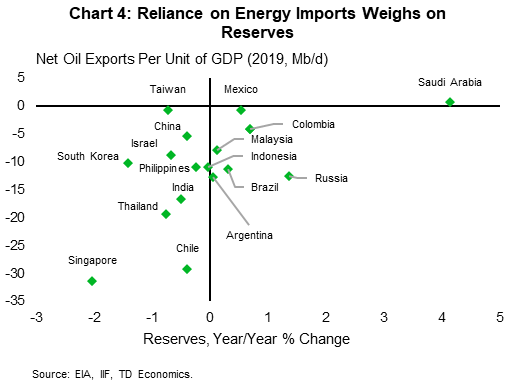
Creating a buffer heading into this year's perfect storm of monetary tightening ahead of the flight to safety has proven prescient for many EMs. As the Fed's aggressive tightening cycle got underway, countries were in a position to deploy reserve buffers to stem their currency's slide against the dollar (Chart 3). South Korea, India, Chile, and Brazil are standouts here, selling reserves through the first nine months of the year. Beyond active operations, additional drawdowns have been the result of the surge in commodity prices that has left many countries, and particularly those reliant on energy imports, running down their foreign currency savings (Chart 4). Yet, despite the challenges, most countries maintain reserves levels comfortably above the recommended IMF thresholds. The notable exceptions are South Korea, Chile, and Malaysia who have run down their balances over the past year (Table 1).
Indeed, for most EMs under study here it would take drawdowns similar to the worst of the Asian Financial Crisis (1997-1998), or the Global Financial Crisis (2008-2009), before reserve balances deteriorated below recommended levels. As a case study, applying the most severe annual drawdowns from those episodes exacerbates conditions in countries already falling short of the IMFs metric and results in Indonesia and Brazil being added to the list of risky countries. They key takeaway here is that most EMs are starting the slowdown in a position of relative strength. That is not to say that there are no risks, but the size of the shock would have to be substantial to have a large, destabilizing effect.
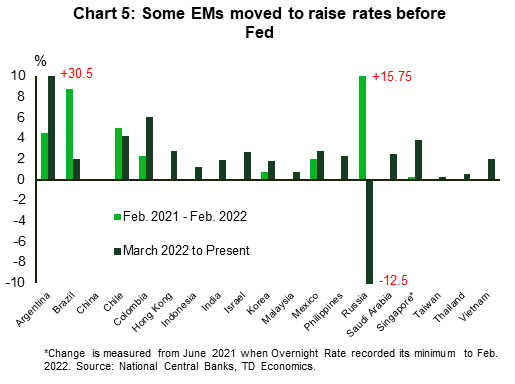
Ample reserves form one bulwark against currency depreciations, but monetary policy also plays an important role. As inflation picked up in 2021 a number of EM central banks started their rate hiking cycles well before their advanced economy counterparts (Chart 5). Of the 19 countries included in the Fed's trade weighted dollar basket, 7 started raising rates before March 2022 (the month the Fed raised rates the first time), 7 after, and 3 moved the same month. The monetary policy tightening at a time the Fed was signaling no rate changes built a cushion to help sustain capital inflows through 2021. China and Russia are the outliers from the group. The former is dealing with domestic economic issues, while the latter is cutting rates after abruptly raising them to stem capital outflows after invading Ukraine.
Looking forward, there is a daunting stock of debt that needs to be serviced. EMs borrowed heavily to offset the effects of the pandemic, pushing debt relative to the size of their economies to record highs. Yet, even here there is a silver lining.
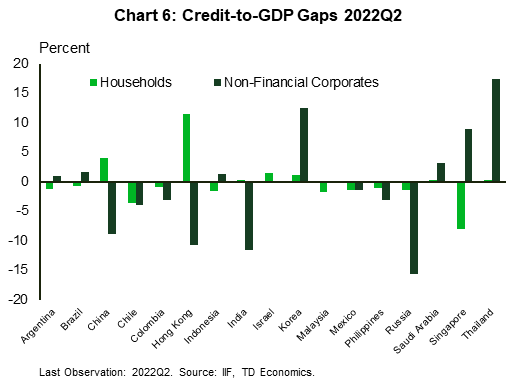
The credit-to-GDP gap – the difference between the current credit-to-GDP ratio and the historic trend – gives an indication of how far domestic sector are beyond historic borrowing patterns. As of the second quarter, South Korea and Saudi Arabia are the only major emerging markets where both household and non-financial corporate debt are above their respective long-term trends (Chart 6). Moreover, in the case of Saudi Arabia, this is not all that worrisome given the strong economic growth projected this year as energy prices remain elevated.
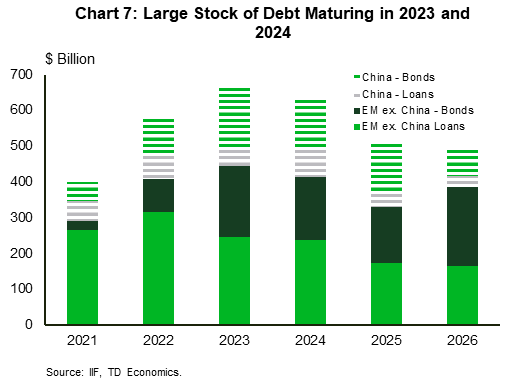
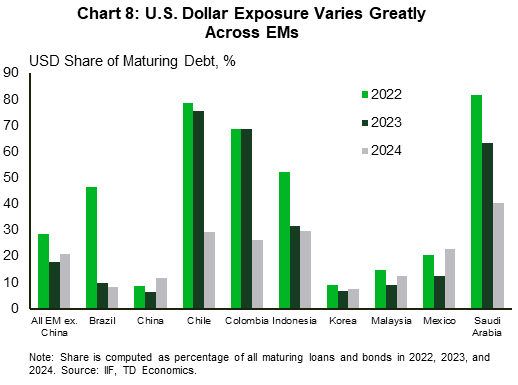
What is worrisome is the volume of U.S. dollar debt due in the coming years. Across EMs, roughly 660 billion in U.S. dollar denominated debt is maturing in 2023, and another 630 billion in 2024 (Chart 7). Faced with a stronger U.S. dollar, and significantly higher interest rates, the cost of debt has risen sharply. Thus, the upcoming need to roll over the obligations could produce a significant drag on economic activity beginning in 2023. Knowing that Chile has already drawn reserves down below recommended levels (Table 1), the fact that 75% of its maturing debt in 2023 is U.S. denominated adds to the concern (Chart 8). Indeed, the IMF has already approved an $18.5 billion flexible credit line for Chile "to provide insurance against adverse scenarios".3 It's possible that other countries may follow this approach in preventative measures.
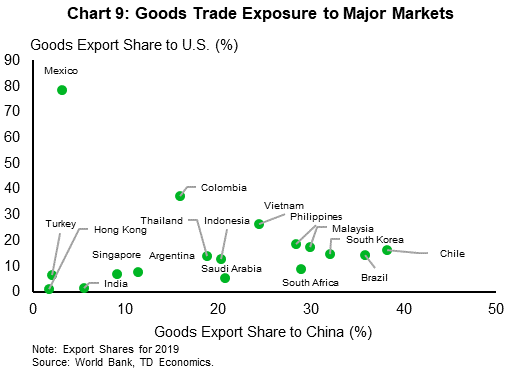
Moreover, slowing demand in the U.S. and China are putting additional strain on coffers as replenishing hard currency stockpiles becomes more difficult. Those economies most reliant on exports to these economic powerhouses are facing a steep slowdown in demand for goods and services (Chart 9).
Countries are also facing domestic challenges. Real incomes are contracting as import prices rise faster than export prices, creating a classic terms of trade shock. Additionally, as we highlighted in recent work, food expenditures make up a larger share of household expenditures in emerging economies. This year's shock to food prices, and an uncertain outlook for 2023 amid prohibitive fertilizer costs, will leave little income left over for households to support domestic demand. Slowing economic activity at home amid softening external demand will add strain to government coffers heading into a year with substantial debt rolling over.
That is why, despite having weathered the initial storm admirably, the outlook is mixed. For most countries, ongoing outflows and falling reserve balances should be manageable through next year. The most present risk over the next 12-to-24 months is that inflation in the U.S. proves to be even more persistent than expected and the Fed further extends its rate hiking cycle. In that event, even the solid buffers countries have developed may begin to dry up.
What this makes clear is that there is no "one-sized-fits-all" narrative for emerging market economies. For the most part, large EMs have proven to be resilient to the shocks thus far in 2022, but an increasingly challenging global outlook in 2023 means those rainy-day savings will still be needed.
End Notes
- International Monetary Fund (Oct. 2022) "Global Financial Stability Report": https://www.imf.org/en/Publications/GFSR/Issues/2022/10/11/global-financial-stability-report-october-2022
- Emerging markets included in the trade-weighted dollar basket are Argentina, Brazil, China, Chile, Colombia, Hong Kong, Indonesia, India, Israel, South Korea, Malaysia, Mexico, Philippines, Russia, Saudi Arabia, Singapore, Taiwan, Thailand, and Vietnam.
- IMF (Aug. 2022) "IMF Executive Board Approves Two-Year US$18.5 Billion Flexible Credit Line for Chile": https://www.imf.org/en/News/Articles/2022/08/29/pr22294-chile-imf-executive-board-approves-two-year-flexible-credit-line-for-chile
Disclaimer
This report is provided by TD Economics. It is for informational and educational purposes only as of the date of writing, and may not be appropriate for other purposes. The views and opinions expressed may change at any time based on market or other conditions and may not come to pass. This material is not intended to be relied upon as investment advice or recommendations, does not constitute a solicitation to buy or sell securities and should not be considered specific legal, investment or tax advice. The report does not provide material information about the business and affairs of TD Bank Group and the members of TD Economics are not spokespersons for TD Bank Group with respect to its business and affairs. The information contained in this report has been drawn from sources believed to be reliable, but is not guaranteed to be accurate or complete. This report contains economic analysis and views, including about future economic and financial markets performance. These are based on certain assumptions and other factors, and are subject to inherent risks and uncertainties. The actual outcome may be materially different. The Toronto-Dominion Bank and its affiliates and related entities that comprise the TD Bank Group are not liable for any errors or omissions in the information, analysis or views contained in this report, or for any loss or damage suffered.
Download
Share: