What Happens in Japan May Not Stay in Japan
Date Published: March 31, 2026
- Category:
- Global
- Asia
- Global Economics
Highlights
- After decades of low inflation and near-zero interest rates, Japan is transitioning to a materially positive rate environment.
- Japan’s rate normalization is reducing outward investment by domestic investors, especially insurers and pensions, withdrawing a key source of stable, long-duration demand for U.S. Treasuries.
- Even an orderly adjustment will place upward pressure on U.S. term premia. With reduced Japanese demand and large fiscal deficits, the market will require a higher level of long-term Treasury yields.
- Recent volatility in energy markets has raised the risk of a rapid unwind of yen-funded carry trades. In a worst-case scenario, leveraged positions unwind quickly, straining market depth and further increasing Treasury market volatility.
Japan holds roughly $1.2 trillion in U.S. Treasuries, making it the largest foreign creditor of the U.S. government. For decades, near-zero domestic interest rates pushed Japanese savings abroad, creating a large, stable, long-duration investor base that helped anchor long-term yields well beyond Japan’s borders.
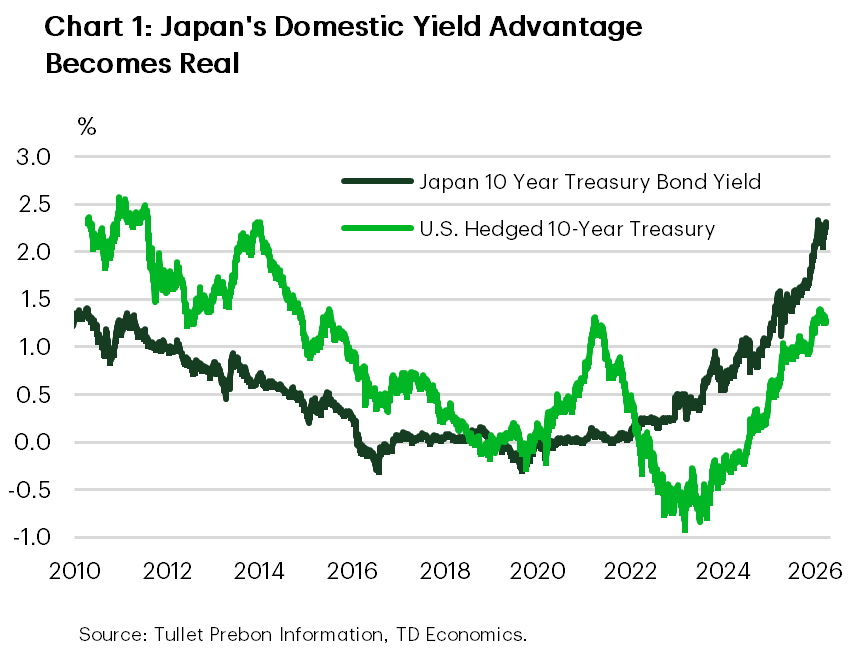
That era is ending. With the Bank of Japan signaling further rate hikes, the 10-year Japanese government bond yield has risen to around 2.3%, near multidecade highs. Higher yields in Japan’s domestic bond market are weakening the incentive for Japanese investors to continue buying U.S. Treasuries.
Recent energy‑price volatility has compounded these pressures by raising inflation risk and funding costs simultaneously. After a brief rally, the 10-year Japanese government bond (JGB) yields have returned to recent highs, while the yen has retraced its January lows. Taken together, these shifts mean that JGBs continue to offer competitive returns, even as financial conditions weigh on domestic activity. This gives Japanese investors greater scope to allocate capital at home and reduces the need to seek yield offshore (Chart 1).
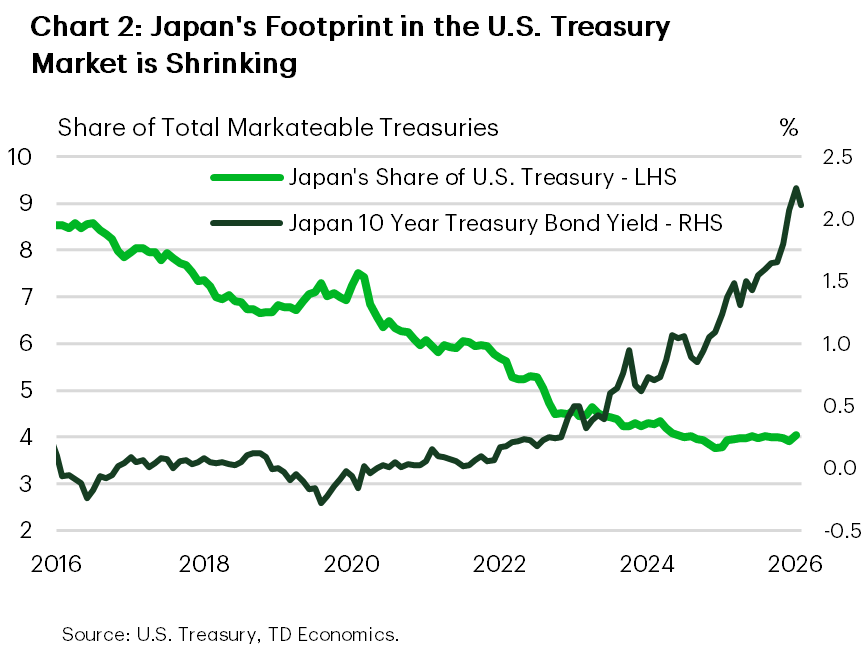
This reallocation diminishes a long standing source of stable demand for U.S. Treasuries at a time when the U.S. government is financing deficits nearing $2 trillion annually. Japan’s share of U.S. Treasury holdings has trended lower over the past decade, briefly stabilizing around 4% in recent years. With domestic yields rising, that decline is likely to resume (Chart 2).
As long as the adjustment unfolds gradually, the result will be modest, but persistent, upward pressure on long-term yields. However, rising Japanese yields also weaken the economics of yen-funded carry trades, introducing a second and more nonlinear channel through which Treasury demand may adjust. If accompanied by sharp currency moves or rising volatility, this channel could force yields to adjust more abruptly as demand fragments.
A Structural Reallocation by Japanese Investors
Japan’s monetary normalization has unfolded in a relatively swift manner. After widening its Yield Curve Control band in late 2022, the Bank of Japan exited the framework in March 2024 and raised policy rates to 0.75% in late 2025. As a result, long-dated Japanese government bond yields now stand at multidecade highs.
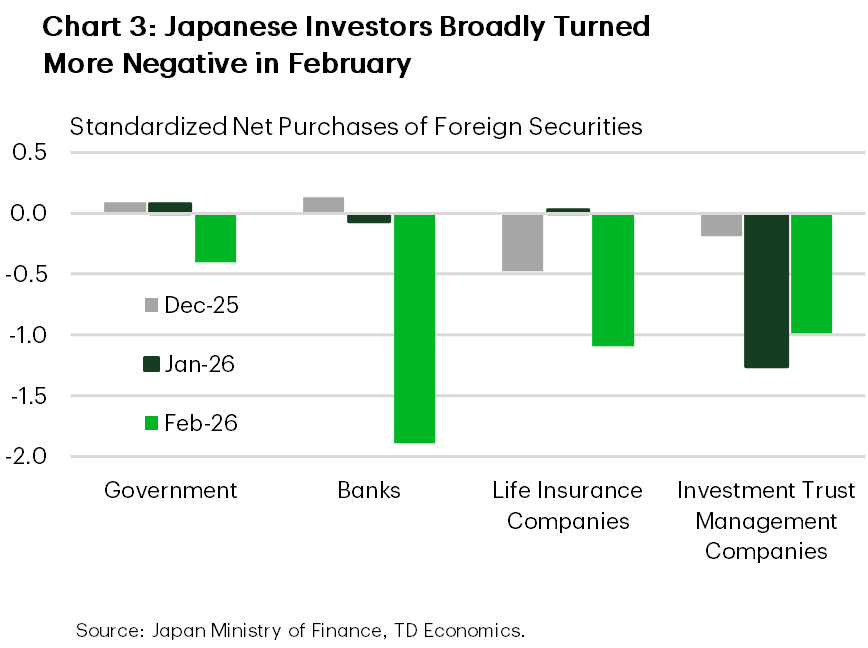
This repricing is reshaping investor behavior. For the first time in decades, domestic investors can earn roughly 2.3% in the local market, compared with closer to 1.3% on a fully hedged U.S. Treasury investment.1 The data confirm the shift: outward investment has slowed materially. Ministry of Finance data show sustained net sales of foreign securities totaling ¥4 trillion (USD $25 billion) since the start of 2026, with declines visible across most investor categories. Monthly figures point to a particularly sharp pullback in recent months (Chart 3), including among government-related investors, that have historically been among the most stable buyers.
The transition has so far proceeded in an orderly fashion. Japanese investors typically hold long-term, liability matched portfolios, and portfolio adjustments tend to occur incrementally rather than through forced selling. Reduced Japanese demand exerts gradual upward pressure on U.S. term premia, allowing Treasury yields to rise through price adjustment rather than market stress.
Less Japanese Demand Must Be Met Elsewhere, Likely At Higher Yields
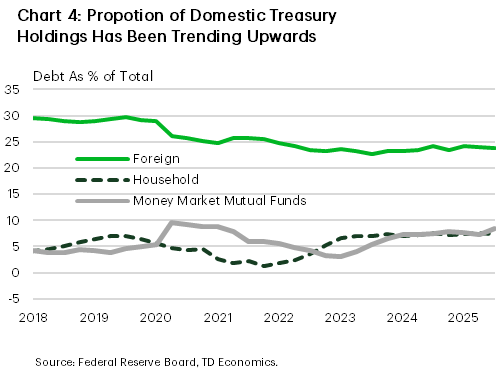
The loss of Japanese demand means other investors must step in and fill the gap. Domestic Treasury holdings have been trending upward, but the scale of that demand is unlikely to match Japan’s long duration institutional base except at lower prices/higher yields (Chart 4).
Based on historical episodes of foreign demand withdrawal and the scale of Japan’s holdings relative to outstanding supply, we estimate that this dynamic could add 20 to 50 basis points to the U.S. 10-year yield in the medium term.2
When Structural Adjustment Becomes a Carry-Trade Unwind
The rapid run-up in energy prices is a major, negative terms-of-trade shock for Japan and has implications for global yen-funded carry trades. While yen depreciation can support open carry trades, the viability is increasingly challenged by higher Japanese funding costs, narrowing yield differentials, and elevated volatility. In this environment, carry trades become highly asymmetric: relatively small adverse moves can quickly overwhelm months of carry, prompting rapid deleveraging rather than gradual adjustment.
The pace of adjustment is the primary risk to the macrofinancial environment. The episode in January of this year, when bond investors panicked over the government’s fiscal plans, resulting in a day of extreme volatility, demonstrated how quickly things can shift. In one day, the 30-year Japanese government bond yield spiked nearly 30 bps, while the U.S. 10-year yield moved roughly 8 basis points almost immediately in response. Of course, this is not the first time a rapid adjustment in a foreign bond market spread to U.S. treasuries. During the 2015 Bund selloff and the Bank of Japan’s 2022 Yield Curve Control adjustment, sharp moves in their sovereign yields were followed by abrupt repricing in U.S. Treasuries.
Bottom Line
Japan’s exit from ultra-low interest rates is reshaping global capital flows. Even under an orderly transition, reduced Japanese demand shifts a greater share of Treasury issuance toward price sensitive investors, requiring higher yields to clear the market. The result is a higher equilibrium level for long-term U.S. rates, independent of Federal Reserve policy and persistent even in stable economic conditions.
Replacement demand is likely to come from investors that are more cyclical and yield sensitive than Japan’s long duration institutional base. That substitution will occur, but only at higher yields.
Higher, less stable demand leaves the financial system more exposed to adverse shocks. In a more volatile world, the loss of stable Japanese investors raises the odds of sharper Treasury repricing when shocks hit.
End Notes
- The U.S. hedged rate is calculated as (US-10 year – (US 3 month – Japan 3 month))
- https://www.kansascityfed.org/research/economic-bulletin/the-changing-investor-composition-of-us-treasuries-part-1-foreign-treasury-sales-could-raise-us-yields/
Disclaimer
This report is provided by TD Economics. It is for informational and educational purposes only as of the date of writing, and may not be appropriate for other purposes. The views and opinions expressed may change at any time based on market or other conditions and may not come to pass. This material is not intended to be relied upon as investment advice or recommendations, does not constitute a solicitation to buy or sell securities and should not be considered specific legal, investment or tax advice. The report does not provide material information about the business and affairs of TD Bank Group and the members of TD Economics are not spokespersons for TD Bank Group with respect to its business and affairs. The information contained in this report has been drawn from sources believed to be reliable, but is not guaranteed to be accurate or complete. This report contains economic analysis and views, including about future economic and financial markets performance. These are based on certain assumptions and other factors, and are subject to inherent risks and uncertainties. The actual outcome may be materially different. The Toronto-Dominion Bank and its affiliates and related entities that comprise the TD Bank Group are not liable for any errors or omissions in the information, analysis or views contained in this report, or for any loss or damage suffered.
Download
Share: