Commodity Price Report
Marc Ercolao, Economist
Date Published: May 4, 2023
- Category:
- Canada
- Forecasts
- Commodities & Industry
Highlights
- Commodity markets kicked off the year on more stable ground after undergoing bouts of extreme volatility in 2022. However, over the past month, volatility has returned in some commodity areas, notably crude oil.
- The overall global demand outlook for commodities remains cloudy amid heightened recession risks in the major advanced economies. Still, a number of factors are expected to limit major downside to prices. These include China’s post-pandemic reopening, persistent low inventories, uncertainty around the Russia-Ukraine war, and supply-side underinvestment.
- Idiosyncratic factors drove divergences in energy markets. OPEC has demonstrated their willingness to try keeping a floor under crude prices, while weather-related anomalies spurred a hasty decline in natural gas prices. With natural gas prices expected to narrow some of the gap against oil going forward, the outlook for energy markets is cautiously positive.
- Industrial metals will continue to be supported by China’s recovery, with already-depleted inventories at risk of coming under further pressure. Aluminum and zinc inventories will face relatively more strain, creating a pillar for sustainably higher prices. Copper and nickel markets may shift into surplus as near-term production outpaces demand.
- Precious metals have outperformed the rest of the commodities complex year-to-date. The bullish outlook for gold is driven by an expectation of rate cuts, a downtrend in the USD, and robust physical demand, especially from central banks. Silver’s strong positive correlation to gold should lend support to prices.
- Agricultural commodities are hanging in the balance. The push to bring supply back to market has been hampered by disruptive weather in the US and Canada, but the extension of the Black Sea grain deal is temporarily easing the pressure in wheat markets. Canola still faces some downside risk as Canadian exporters compete with Australian product.
- Lumber prices are set to rise after their precipitous decline from peak 2022 levels. However, restrictive monetary policy activity and only slowly recovering real estate activity will limit the upside.
- Livestock prices have diverged to start the year with cattle prices moving higher and hog prices retreating. Both commodities are experiencing inventory shortages with seasonal consumption patterns likely offering a near-term lift to prices.
Cautiously Bullish Outlook for Crude
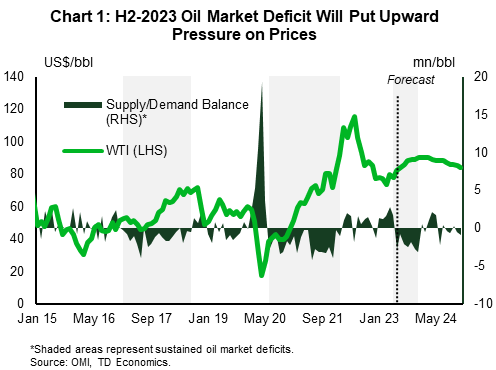
Crude oil kicked off the year struggling to find direction as WTI traded between $70-80/barrel until mid-March. Promising demand prospects from a robust economic recovery in China is acting as a counterbalance to the mixed demand outlook for crude across other major economies entering a period of slowdown. But since mid-March, a higher level of volatility has returned. WTI prices temporarily slipped to a 15-month low of $65/barrel on banking-related fears in the U.S. and Europe. Since then, crude shot back up to north of $80/barrel following OPEC+’s surprise announcement for voluntary production cuts that could see 1.6 million additional barrels (between 1-2% of global oil demand) come off the market starting in July. Crude’s recent OPEC-induced bull run has been short-lived as prices have now retreated back to $70/bbl level.
Even before the cartel’s most recent announcement on April 2, we believed that that supply-demand fundamentals within global crude oil markets would flip from a modest surplus to a slight deficit position in the latter half of this year (Chart 1). In fact, both the IEA and OPEC’s most recent projections suggest a similar path for crude markets, with China’s demand recovery being a fundamental reason for the tightening in supply-demand conditions by the end of the year. The Chinese recovery thus far has been sound with first quarter growth coming in at a rapid 2.2% on a q/q seasonally-adjusted basis. A rebound in Chinese domestic consumption is taking place while the property sector is showing some signs of life, albeit from very depressed levels. High frequency data around traffic, public transit usage and flights have also shown durable improvements, spurring higher demand for gasoline, diesel, and jet fuel. Even as consumption from advanced economies likely slows, we still see global oil demand gaining some traction in the coming quarters on the back of China’s recovery.
As current-quarter fundamentals are appearing vulnerable, we’ve marked down or Q2-23 WTI forecast to $78/bbl ($83/bbl previously). However, our call for $90/bbl by year-end remains unchanged, as OPEC+ has demonstrated its willingness to intervene as the global major swing producer, ultimately keeping a floor under crude prices. As for their most recent announcement, there is good reason to believe that the production curtailments can be delivered close to their entirety, further tightening what is expected to be a supply-strained market. OPEC+ members making voluntary commitments to cut production are producing close to their quotas. This would contrast with the group’s plan last autumn to collectively cut 2 million b/pd from their collective output target. At that time, OPEC+’s combined production was already lagging planned levels with only select members needing to make cuts.
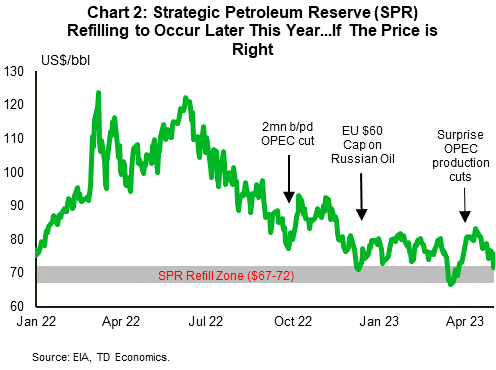
Since November 2021, the Biden administration has drawn down their Strategic Petroleum Reserve (SPR) by about 50%. The volume of emergency oil now sits at its lowest levels since the early 1980s, meaning the U.S. will have less firepower to respond to sudden supply shortages. The U.S. government continues to reiterate their intention of refilling the SPR this fall if oil prices are in the right place (~$70/bbl). And if prices reach this level, the gradual refilling of the SPR will act as another demand buffer later this year (Chart 2).
Natural Gas is Finding its Bottom
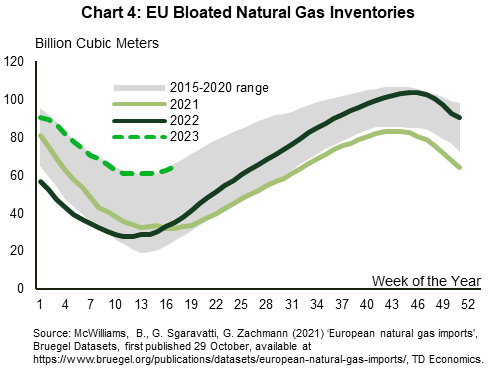
Natural gas prices turned in their worst quarter on record in Q1-23 as a seasonally mild winter resulted in weak demand for gas in Europe and North America. Henry Hub futures, the North American benchmark, slid around 80% from last year’s peak and currently trade at around US$2.15/bbl. The European benchmark Title Transfer Facility (TTF), currently at US$12/mmbtu, is down nearly 60% from last quarter of 2022 and well off the US$90/mmbtu peak from August 2022. As a result of blunted demand, natural gas storage levels in the U.S. and the EU are hovering well above their 5-year average levels (Chart 3 and 4).
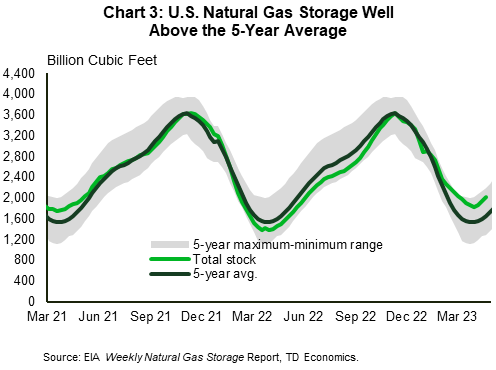
April typically marks the beginning of the storage injection season – the period between April and October where gas demand generally decreases alongside continued production. This year’s injection levels are expected to match historical inflows to storage, which would leave inventories 6% higher than average levels by October 2023. This figure would be higher, but pipeline maintenance in West Texas and the Northeast will lead to slight declines in production against year-ago levels. Overall, relatively flat U.S. natural gas production over injection season combined with rising demand for feed gas from Freeport LNG and increased natural gas consumption in the electric power sector will offer a gradual lift to natural gas prices over the course of this year. We forecast 2023 average annual prices at $2.75/mmbtu with a $2.00/mmbtu acting as a floor for natural gas.
Beyond U.S. borders, the demand outlook is promising. China’s LNG demand is still a wildcard, but it is still believed to notch a healthy 10% annual increase in 2023 according to the IEA’s latest estimates. This may have near-term implications for gas availability in Europe as Asia secures supply via long-term negotiated deals. This will fiercen the global competition in the LNG market, especially as the EU continues to wean itself off of Russian energy supplies. Ports in the Bloc will continue to look west in the U.S. for LNG supply – last year, the EU more than doubled the volume of imported U.S. LNG. The Freeport LNG export facility, now fully operational, may help to ease future supply concerns in Europe as pipeline gas flows from Russia continue to be choked off.
Industrial Metals: Supply Adjustments Will Vary Against an Optimistic Demand Picture
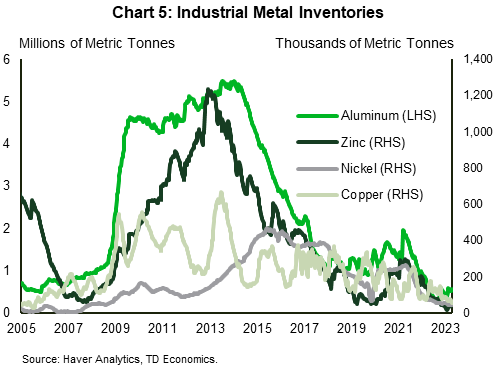
China makes up roughly half of the global demand for industrial metals, so it is no surprise that the gradual return of industrial activity in the country will be a key driver for metals markets this year. From a more holistic viewpoint, supply constraints, dwindling inventories and improved risk appetite is supporting the metals space. Chart 5 highlights the tight visible inventory levels across industrial metals, where pressures will continue to mount as the demand picture firms up. Outside of China, the magnitude of the global growth drag is still highly uncertain, though growth in the current quarter has held up reasonably well across advanced economies.
After cratering from all-time highs in mid-2022, copper prices have embarked on a partial rebound so far this year, to around the $4.00/lb mark. Copper, often viewed as a bellwether of world economic conditions given its widespread use, stands to benefit from China’s outsized reliance on the metal. Similar to energy markets, optimism out of China should support base metal demand even as global economic weakness takes hold. While copper inventories are in fact lean, a potential stockpile representing about 1% of global demand could be made available to markets via resolutions of a royalty dispute with the Democratic Republic of Congo (DRC). This would weigh on an already delicate market balance forecast for the year. Meanwhile, copper prices are also generally sensitive to developments out of major Latin American producing countries, which together currently account for a lofty 40% share of global production. As recent production disruptions in the region abate–for example, the activity improvement in Peruvian copper mines after protest-induced disruptions from earlier this year–increases in supply may push market balances further into surplus territory by 2024. We see prices remaining relatively flat throughout 2023, reaching the $4.15/lb level by end of the year, before declining to about $3.70/lb by end-2024. Copper is becoming more far-reaching, extending beyond traditional industrial uses. Longer-term, copper will continue to play a big role in decarbonizing the economy as its use in energy application translates to higher efficiency and reliability.
Nickel prices have experienced some of the most volatile moves across the metals space as the market has suffered from a lack of liquidity. As a result, fundamental relationships have been a bit more tenuous. Recent data from the Nickel Study Group shows Indonesian output driving large year-on-year gains in overall nickel production this year. By most metrics, demand over the coming year should be healthy as the EV sector quickly becomes an important nickel consumer. However, new demand won’t be near enough to absorb the production wave, which could toss the supply-demand balance into the largest surplus of the decade. As such, we see nickel prices sliding to US$10.50/lb by end-2023 and $US10.00/lb by end-2024.
Despite recent build-ups, aluminum inventory at LME warehouses is hovering at around 50% of pre-pandemic levels. China has cemented itself as the global leader in primary aluminum production, accounting for nearly 60%. However, further production, which is very energy and carbon intensive, may be strained as major producers in China continue to struggle with power supply shortages. This is compounded by ongoing production shut-ins from major European smelters last year, when soaring power and gas prices threw the aluminum production industry into a tailspin. Offsetting some of the potential inventory strain are high volumes of Russian aluminum that has been finding its way to LME warehouses as of late. We expect aluminum to average $US1.06/lb in 2023, down from $US1.23/lb last year and moving upwards to $US1.14/lb in 2024.
Zinc has underperformed against other base metals year-to-date, down over 10%, as demand robustness lagged given its more unidimensional uses vs other metals. Price weakness is occurring simultaneously with severely depressed visible zinc inventories that are currently at levels not seen since 1989. Like aluminum markets, European zinc smelters had curtailed production amid elevated power costs, a major contributor to the current inventory shortage. Looking ahead, the demand picture is promising. According to the International Lead and Zinc Study Group (ILZSG), a ramp up in global demand for refined zinc metal will flip markets into a deficit this year. At US1.20/lb, current zinc prices have retraced back to early-2021 levels, but we forecast prices to move higher from here, reaching $US1.45/lb by end-2023 and $US1.50/lb by the end of 2024.
Precious Metals Remain Well Supported
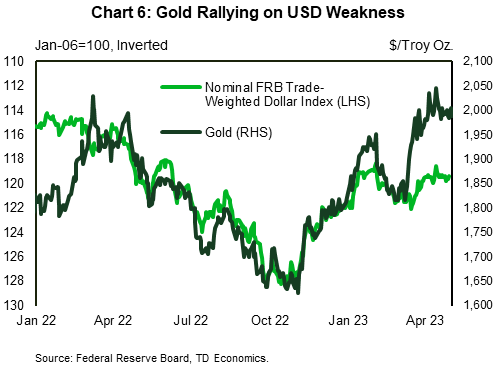
Gold prices have nearly recaptured the ~20% peak-to-trough slide from last year, currently trading around the $2000/oz mark and close to record highs. Markets are viewing the outlook for the US economy with a shade of pessimism and have decidedly re-priced the Federal Reserve’s policy rate path to reflect rate cuts in the back-half of the year. This is despite the Federal Reserve’s continued commitment to restrictive monetary policy and our own forecast that rate cuts will not begin until early-2024. Since late last year, a near-10% pull-back in the US dollar has provided a strong underpinning for the yellow metal (Chart 6). Upward pressure on gold is also being exerted by central banks who have been net purchasers for 11 straight months, beefing up their reserves. Haven demand has strengthened as central banks look to diversify their portfolios amid concerns of ongoing geopolitical risk. All said, gold has more upside as speculators continue to anticipate an earlier Fed cutting cycle. We are projecting nominal and real bond yields to head lower in the back half of the year, and coupled with strong physical demand, we see gold notching a new all-time high of $2,100/oz by the end of 2023.
Silver prices, influenced by many of the same forces that drive bullion, should follow suit. Silver however is used as an input to more industrial uses and short-term fluctuations will be more closely tied to growth in China’s industrial sector.
Lumber Prices To Slowly Recover, But Not Without Some Resistance
Lumber prices have finally settled after whipsawing on multiple occasions over the past few years. Lumber futures, currently trading at $350/thousand board feet, are roughly in line with pre-pandemic levels. As central banks kicked off aggressive rate hiking campaigns early last year, lumber prices dropped precipitously, in line with rapidly slowing real estate activity. Last year’s sharp drop in prices and sluggish demand forced North American producers to curtail output, which has left current inventories low and stoked supply shortage fears for the spring and early summer construction season. Even against this backdrop, any near-term upside in lumber prices will be limited as monetary policy will remain meaningfully restrictive into 2024. U.S. housing starts have only slightly rebounded in recent months, but they remain weak relative to year-ago levels. We do expect homebuilding in the U.S. to start a recovery next year, albeit at a modest pace, as housing affordability remains depressed. Additionally, the renovation boom that added to demand pressure over the pandemic has likely run its course, limiting pressure from this activity channel. All said, we project the price of benchmark Western SPF to slowly climb from current levels to US$450/thousand board feet by the end of the year (average US$430 for the year). For 2024, average prices of US$475/thousand board feet will reflect a normalization in supply/demand conditions.
Agricultural Commodities Could See Some Supply Relief, Prices Under Pressure
Wheat prices have taken a sizeable step down after spiking to nearly $13/bushel at the onset of the Russia-Ukraine war over a year ago. At just over $6.00/bushel, current prices are lower than pre-war levels but still holding above their 10-year average. Overall global production and export activity is improving, a big catalyst being last month’s extension of the UN-backed Black Sea grain deal that allows Ukraine to move its grain supply over the Black Sea. Meanwhile, crop from top exporter Russia is estimated to reach 78 million tonnes in 2023, below last year’s record, but elevated compared to historical standards. However, drought-like conditions in both the Midwest and Canadian prairies, while improving, are threatening crop yields heading into planting season, which could weigh on North American production. As of March 31, 83% of crop land on the prairies was classified as abnormally dry or in some degree of drought. The United States and Canada are the 4th and 5th largest wheat producers globally and as such, North American supply disruptions can more than counteract increased production globally. For now, we expect wheat prices to take a step back from last year’s $8.83/bushel to $7.10/bushel in 2023.
Canola, a staple commodity for the Canadian farmers, recently dipped below the CAD$750/tonne mark, with potential downside still in store. Canadian producers are facing fierce competition from Australian farmers who have harvested record amounts of canola crop. Canadian canola will now need to be priced competitively in major export markets, most notably the EU and China, where Australian product is capturing market share. Domestic production is also expected to ramp up in 2023, with estimates from Statistics Canada’s Principal Field Crop survey pointing to 21.6 million acres, up 0.9% from last year. Canola prices are expected to decline from CAD$972/tonne in 2022 to $760 in 2023 and $740 in 2024.
Cattle and Hog Prices to Receive Seasonal Support as Headcount Stays Depressed
Cattle prices continue to move higher after annual average prices in 2022 ($142/cwt) churned out an impressive 17% gain. We believe prices will sustain their upward march in the near-term, averaging $160/cwt in 2023. Recent draught conditions in many parts of North America caused producers to shift to supplemental feed and forage as planned pastures withered. As a result, cattle producers were incentivized to cull herds as feed costs remain elevated. In both Canada and the U.S., current cattle inventory has shrunk from 2022 levels and remains at historically low levels. As the industry enters the rebuilding part of the cycle, cattle producers will likely retain more heifers for breeding, taking cattle out of the slaughter stream, ultimately reducing meat production. The USDA projects U.S. beef production in 2023 will decline for the first time since 2015, keeping beef prices elevated.
Hog prices started the year by taking a step in the other direction. Unlike cattle, lean hog contracts are down 5%, but seasonal support and falling headcount should support prices through the remainder of 2023. Globally, a surge in African swine fever infections in China is also set to reduce hog output later this year, pushing up prices in the world’s top pork consumer as demand recovers. Compared to 2022, hog prices are expected to decline from an average of US$98/cwt to $84 this year. Prices will remain well supported into 2024 prices, further increasing to an annual average of around US$93/cwt.
Table 1: Commodity Price Forecast
| Spot Price | 2022 | 2023 | 2024 | Annual Average | |||||||||
| 3-May | Q4 | Q1 | Q2F | Q3F | Q4F | Q1F | Q2F | Q3F | Q4F | 2022 | 2023F | 2024F | |
| Energy | |||||||||||||
| WTI Oil ($/bbl) | 68.60 | 83 | 76 | 78 | 86 | 90 | 90 | 88 | 88 | 85 | 83 | 83 | 88 |
| Natural Gas ($/mmbtu) | 2.16 | 5.55 | 2.65 | 2.35 | 2.75 | 3.25 | 3.25 | 3.50 | 3.50 | 3.75 | 5.55 | 2.75 | 3.50 |
| Precious Metals | |||||||||||||
| Gold ($/Troy oz) | 2020 | 1731 | 1889 | 1950 | 2000 | 2100 | 2100 | 2050 | 1950 | 1900 | 1731 | 1985 | 2000 |
| Silver ($/Troy oz) | 25.30 | 21.30 | 21.30 | 24.00 | 24.25 | 24.50 | 25.00 | 24.50 | 24.00 | 24.00 | 21.30 | 23.51 | 24.38 |
| Industrial Metals* | |||||||||||||
| Aluminum (¢/lb) | 106 | 105 | 109 | 98 | 103 | 113 | 111 | 113 | 114 | 116 | 105 | 106 | 114 |
| Copper (¢/lb) | 385 | 363 | 405 | 395 | 418 | 410 | 392 | 383 | 375 | 375 | 363 | 407 | 381 |
| Nickel ($/lb) | 11.32 | 11.53 | 11.81 | 11.11 | 11.11 | 10.50 | 10.50 | 10.50 | 10.00 | 10.00 | 11.53 | 11.13 | 10.25 |
| Zinc (¢/lb) | 119 | 134 | 134 | 136 | 143 | 145 | 150 | 155 | 155 | 150 | 134 | 139 | 153 |
| Agriculture & Forestry | |||||||||||||
| Lumber ($/1000 Bd Ft) | 348 | 439 | 439 | 410 | 425 | 450 | 450 | 475 | 475 | 500 | 439 | 431 | 475 |
| Wheat ($/bu) | 6.25 | 7.54 | 7.27 | 6.83 | 7.10 | 7.20 | 7.20 | 7.20 | 7.30 | 7.30 | 7.54 | 7.10 | 7.25 |
| Canola (C$/mt) | 758 | 872 | 815 | 765 | 750 | 710 | 720 | 740 | 740 | 760 | 872 | 760 | 740 |
| Cattle (¢/lb) | 162 | 152 | 161 | 165 | 165 | 170 | 165 | 160 | 160 | 155 | 152 | 165 | 160 |
| Hogs (¢/lb) | 78 | 86 | 79 | 83 | 85 | 87 | 90 | 92 | 95 | 95 | 86 | 84 | 93 |
Disclaimer
This report is provided by TD Economics. It is for informational and educational purposes only as of the date of writing, and may not be appropriate for other purposes. The views and opinions expressed may change at any time based on market or other conditions and may not come to pass. This material is not intended to be relied upon as investment advice or recommendations, does not constitute a solicitation to buy or sell securities and should not be considered specific legal, investment or tax advice. The report does not provide material information about the business and affairs of TD Bank Group and the members of TD Economics are not spokespersons for TD Bank Group with respect to its business and affairs. The information contained in this report has been drawn from sources believed to be reliable, but is not guaranteed to be accurate or complete. This report contains economic analysis and views, including about future economic and financial markets performance. These are based on certain assumptions and other factors, and are subject to inherent risks and uncertainties. The actual outcome may be materially different. The Toronto-Dominion Bank and its affiliates and related entities that comprise the TD Bank Group are not liable for any errors or omissions in the information, analysis or views contained in this report, or for any loss or damage suffered.
Download
Print Version
Share this: